


What Is Observability? The Fundamentals
Noone can argue that observability is crucial for maintaining the health and performance of applications and infrastructure. Observability refers to the ability to measure and understand the state of a system based on the outputs it produces. This is extremely important for identifying, diagnosing, and resolving issues effectively and efficiently.
Observability is essential for DevOps and SRE teams as it provides a comprehensive, overall view of the infrastructure’s health, enabling proactive maintenance and quicker incident response. It involves collecting and analyzing a variety of data types, including logs, metrics, and traces, to gain insights into system behavior and it can help discover possible anomalies throughout the whole infrastructure.
Observability: Infrastructure & APM
Observability spans between two main focus areas. Infrastructure monitoring and Application Performance Monitoring (APM). Each area provides unique insights into different aspects of system and infrastructure performance:
Infrastructure Monitoring
Infrastructure monitoring focuses on the health and performance of servers, networks, IoT devices, K* clusters and other underlying hardware and software components. Key metrics include CPU usage, memory consumption, disk I/O, and network traffic.
Application Performance Monitoring (APM)
APM is concerned with the performance and availability of software applications. It tracks metrics such as response times, error rates, and transaction volumes to ensure applications run smoothly and meet user expectations. While both areas are important, this guide will primarily focus on infrastructure monitoring metrics.
What’s The Difference Between Observability & Monitoring?
Many people use monitoring and observability interchangeably, but they serve different purposes.
Monitoring: Tracking Known Issues
Monitoring involves collecting predefined system metrics such as CPU usage, memory consumption, and network activity. It helps detect failures and triggers alerts when something goes wrong.
Example: A monitoring tool detects that CPU usage has spiked to 95% and sends an alert to the DevOps team.
Limitation: Traditional monitoring tells you what happened but not why it happened.
Observability: Diagnosing Unknown Issues
Observability goes beyond monitoring by providing insights into system behavior, dependencies, and root causes of failures. It leverages metrics, logs, and traces to analyze complex system interactions.
Example: Observability tools track request latency across multiple microservices and detect that a database query is slowing down response times.
Key Differences Between Observability & Monitoring
- Monitoring tracks predefined metrics and alerts on failures, while observability provides full system insights.
- Monitoring focuses on detecting failures, while observability helps diagnose unknown issues.
- Monitoring uses logs and metrics, while observability includes logs, metrics, and traces.
Monitoring is reactive, while observability is proactive. To ensure reliable infrastructure, teams need both monitoring and observability to detect and diagnose performance issues.
Why Are Observability Metrics Important?
Observability metrics are essential for maintaining system stability, performance, and reliability. These metrics provide valuable insights into system operations and help DevOps, SREs, and IT teams proactively troubleshoot issues before they impact users.
Real-Time Issue Detection
Helps identify performance bottlenecks, slow response times, and system failures as they happen.
Faster Root Cause Analysis
Provides deeper insights into why an issue occurred, not just that it happened.
Proactive Performance Optimization
Helps fine-tune resource allocation, database queries, and application efficiency.
Improved Security & Compliance
Tracks anomalous behavior and unauthorized access attempts, reducing security risks.
Better User Experience
Ensures high availability and fast response times, leading to improved customer satisfaction.
Observability metrics offer a proactive approach to maintaining system health, minimizing downtime, and optimizing infrastructure performance.
Key Infrastructure Monitoring Metrics
Here are some of the most important metrics to monitor:
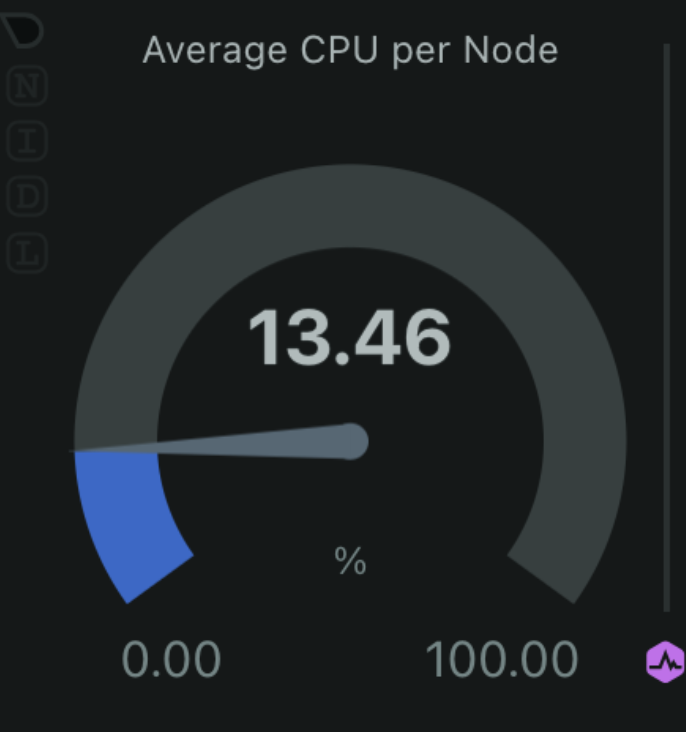
CPU Usage
Why it matters: High CPU usage can indicate that your server is under heavy load, which could lead to performance degradation or outages. How to monitor with Netdata: Netdata provides real-time CPU usage graphs that help you visualize CPU utilization across different cores.
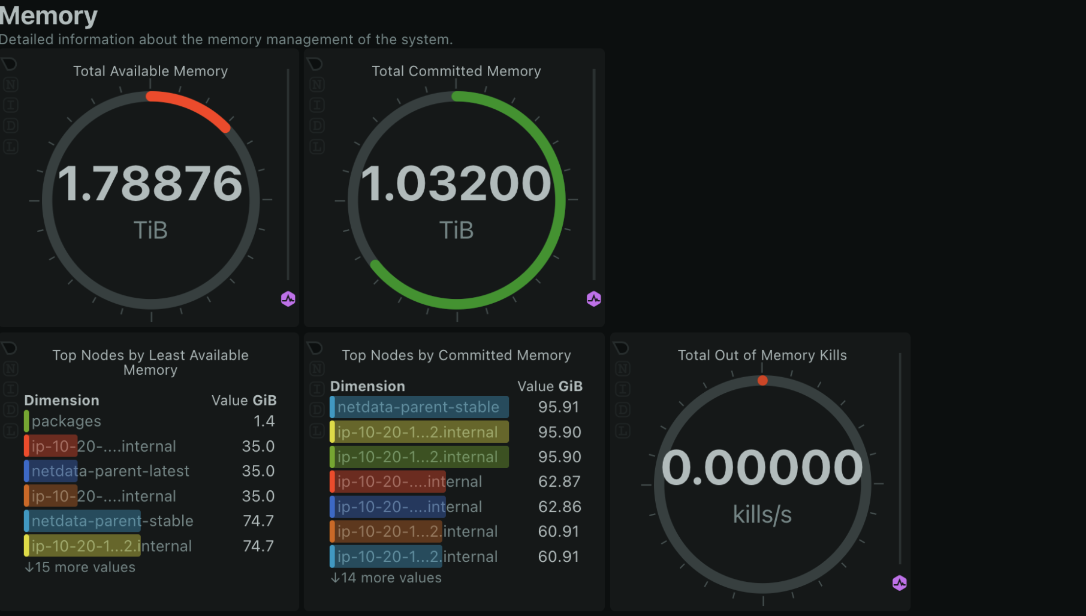
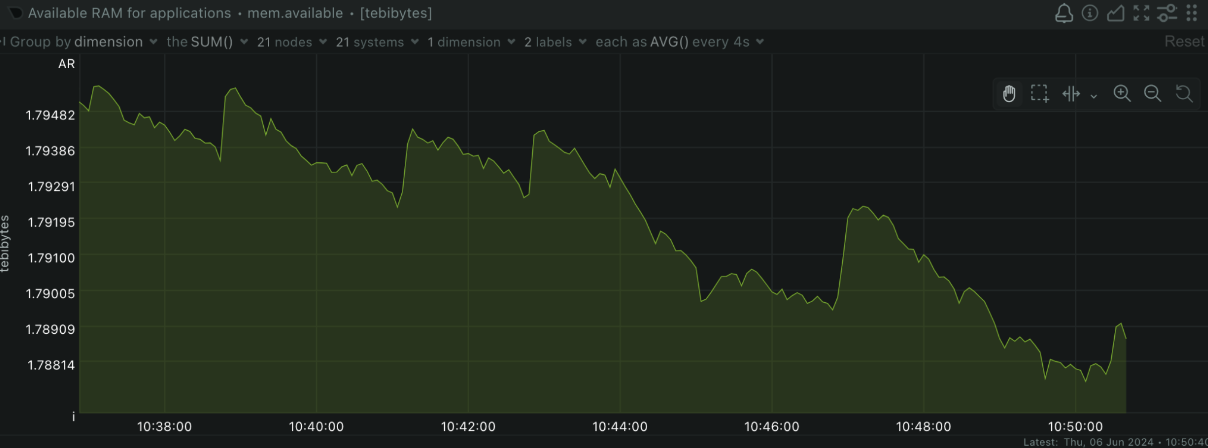
Memory Usage
Why it matters: Monitoring memory usage helps ensure your system has enough RAM to handle its workload without swapping, which can slow down performance. How to monitor with Netdata: Netdata offers detailed memory usage charts, including total memory, used memory, and available memory.
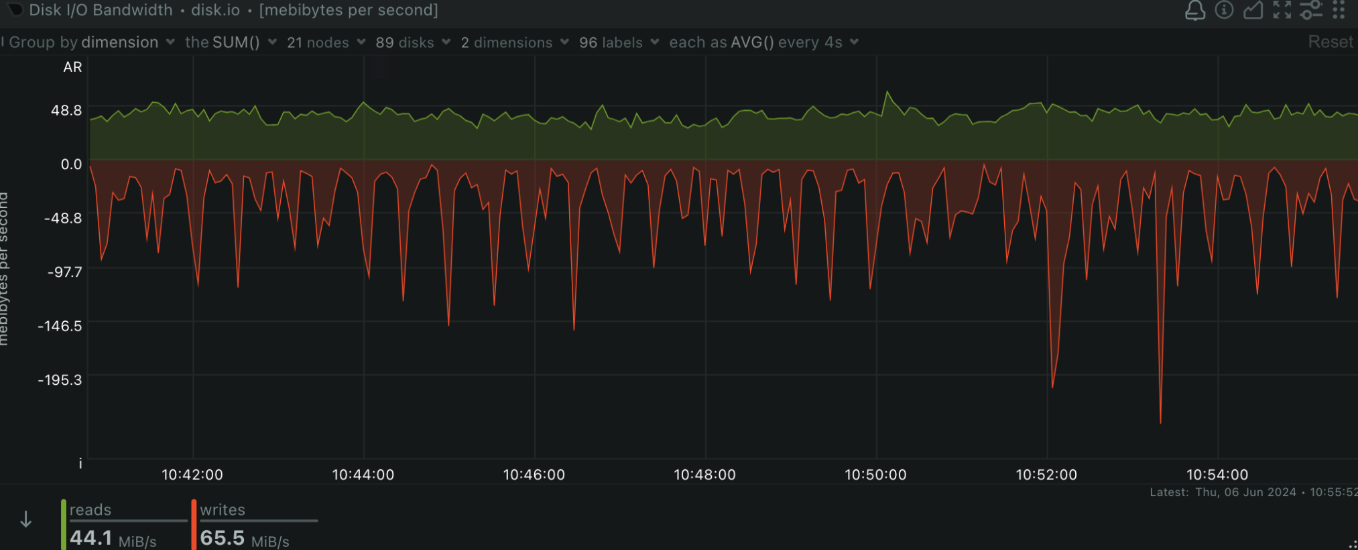
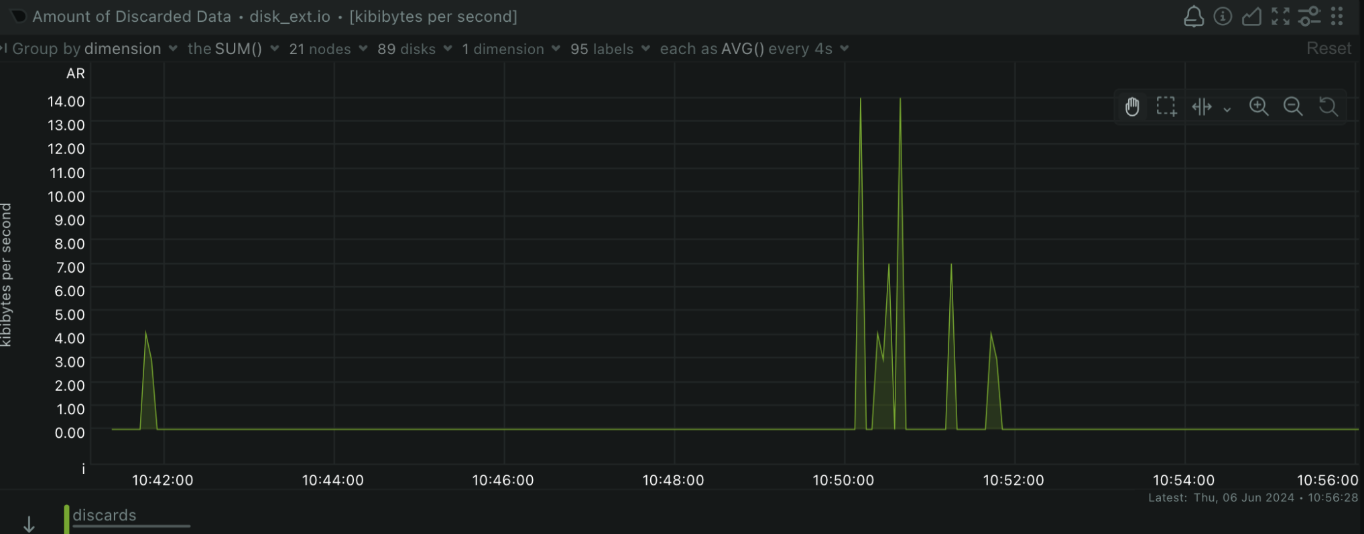
Disk I/O
Why it matters: High disk I/O can indicate that your applications are heavily using the disk, which might lead to bottlenecks and slow performance. How to monitor with Netdata: Netdata provides insights into disk read/write operations, helping you identify potential issues with disk performance.
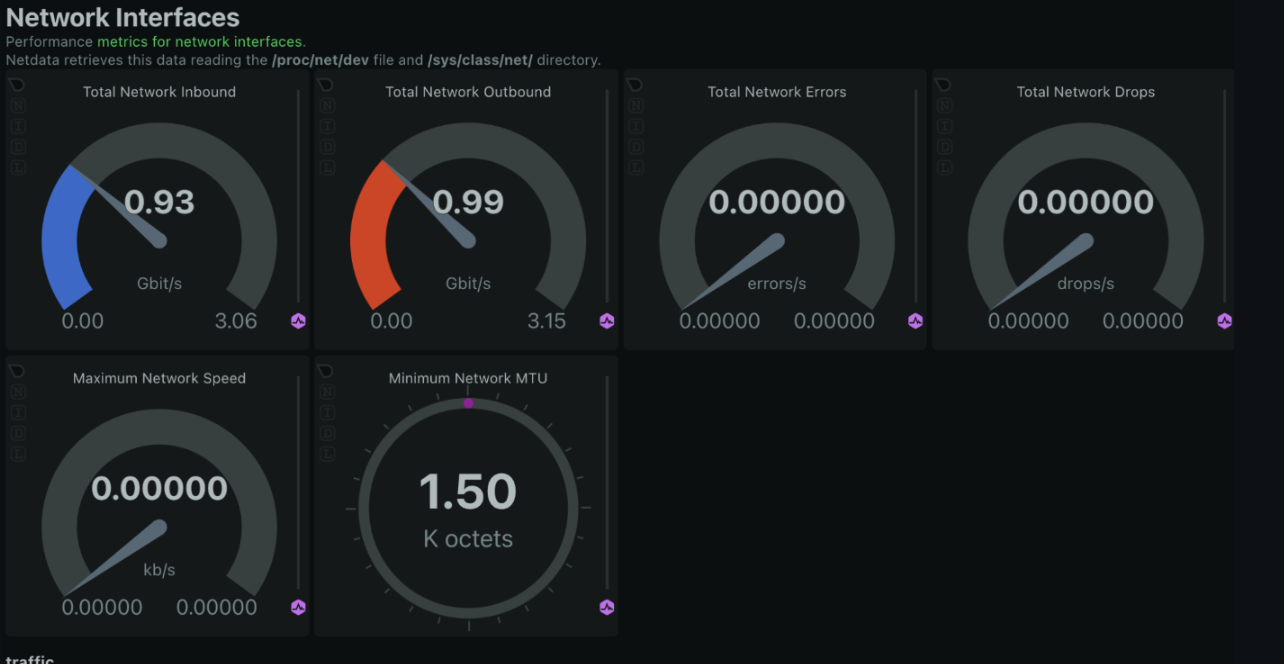
Network Traffic
Why it matters: Monitoring network traffic is crucial for understanding bandwidth usage and detecting potential network issues, such as bottlenecks or unusual activity. How to monitor with Netdata: Netdata’s network monitoring tools show real-time data on incoming and outgoing traffic, packet loss, and error rates.
How Do Logs, Metrics & Traces Work Together In Observability?
Observability is built on three core data types: logs, metrics, and traces. Each plays a unique role in helping teams understand and troubleshoot system behavior.
Logs: The Detailed Event History
Logs are structured or unstructured records of events happening within a system. They capture:
- Error messages & application crashes
- Security events & login attempts
- System & user interactions
Example: A log entry might show a failed authentication attempt or an HTTP 500 error from a web server.
Metrics: The Quantifiable Performance Data
Metrics are numerical representations of system performance, collected over time. They help track trends, detect anomalies, and predict failures.
- CPU & memory usage
- Disk I/O & network latency
- Error rates & request throughput
Example: A metric might indicate that response times increased by 300ms after a recent code deployment.
Traces: The End-to-End Request Path
Traces follow a request across multiple services, showing how it moves through the system. This is critical for identifying bottlenecks and slow dependencies.
- Tracks microservices interactions
- Identifies latency & service failures
- Maps out dependencies between APIs
Example: A trace might reveal that a slow database query is delaying response times for an API request.
How They Work Together
Example scenario: Users report slow loading times on an e-commerce website.
- Metrics show that request latency has increased by 40%.
- Logs reveal multiple database query failures.
- Traces pinpoint that the checkout service is waiting on a slow API response from the inventory database.
Solution: Engineers optimize the database query and scale the API service, restoring performance within minutes.
Logs, metrics, and traces work together to provide full observability, enabling teams to detect, analyze, and resolve issues quickly.
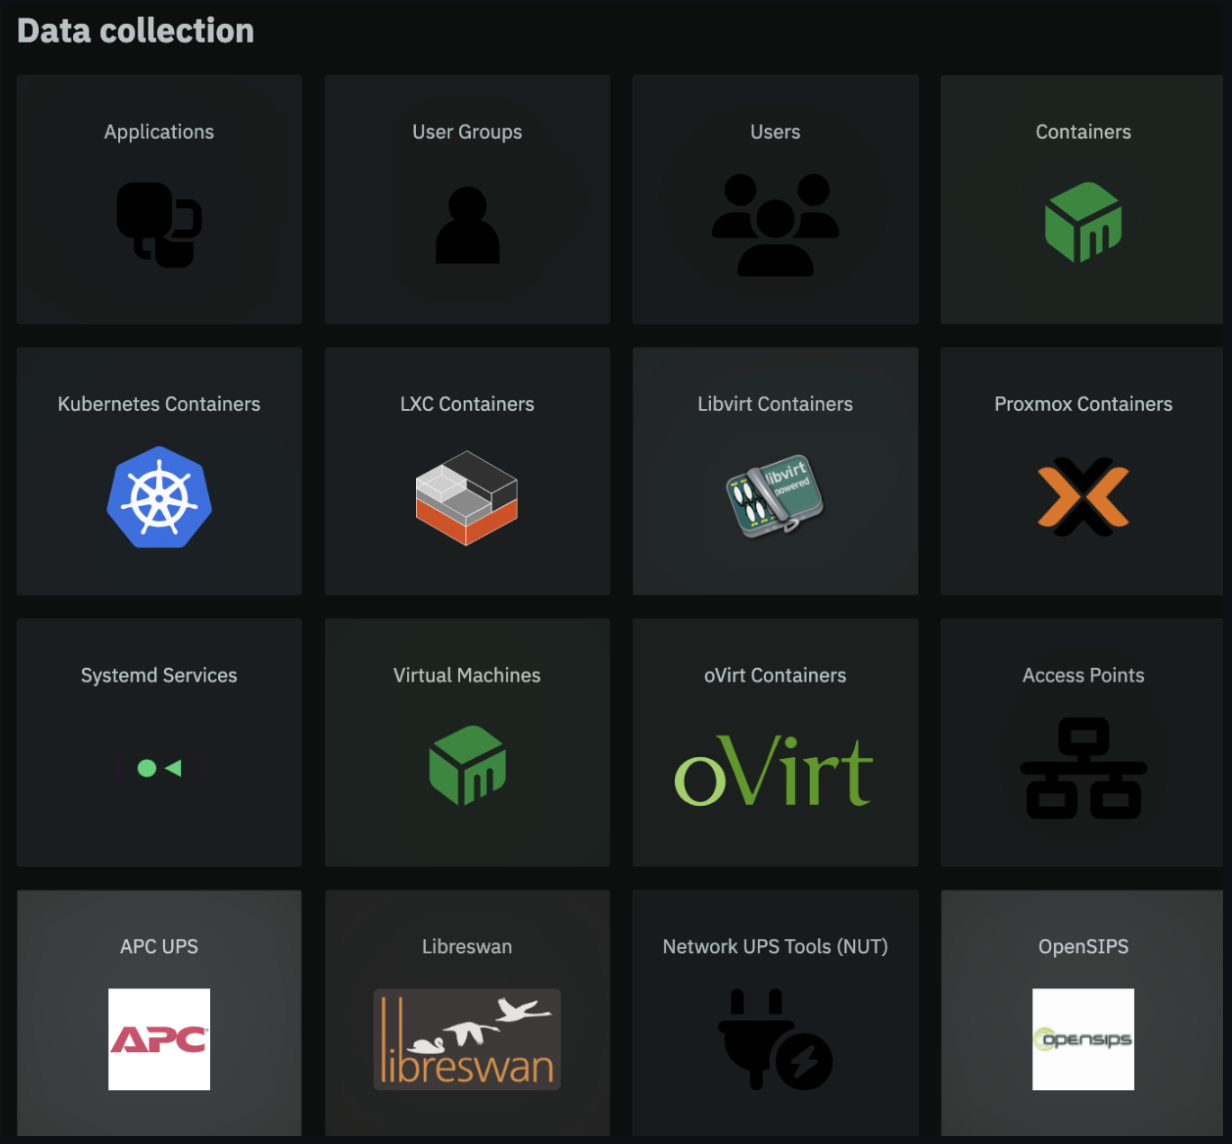
Netdata’s Collectors & Integrations
Netdata offers a vast array of collectors and integrations, making it a versatile tool for monitoring diverse infrastructures. With over 800 integrations available, Netdata can collect metrics from a wide range of sources, providing comprehensive observability for your systems.
Monitor Effectively | Choose The Right Collectors
Selecting the appropriate collectors for your needs is crucial for effective monitoring. Here are some tips to help you choose:
- Identify Key Metrics: Determine which metrics are most important for your infrastructure. This could include CPU usage, memory consumption, disk I/O, network traffic, application-specific metrics, and more.
- Check Compatibility: Ensure that the collectors you choose are compatible with your existing infrastructure. Netdata supports a wide range of platforms, including various operating systems, databases, web servers, and cloud services.
- Review Documentation: Netdata provides extensive documentation for its collectors and integrations. Reviewing this documentation can help you understand the capabilities and configurations of each collector.
Setting Up Collectors In Netdata
Here’s how you can set up collectors in Netdata:
- Installation: Ensure that Netdata is installed on your system. You can use the following command to install Netdata:
wget -O /tmp/netdata-kickstart.sh https://get.netdata.cloud/kickstart.sh && sh /tmp/netdata-kickstart.sh --nightly-channel --claim-token 6UrCTrDuRIm3F-sj89JaEZFqChK7vyOUfTcDZuU4jGVSdrx-WyaKv0LZto8bkF1uijFVyFj5D95j8yo_XfH0rgiyStLbNzXwgLtXIM9_kcZaJHqg-hDmpCup3zqomA-7jzkwGm0 --claim-rooms 6bc24910-5158-48ca-9f22-9ae4aeea0afc --claim-url https://app.netdata.cloud
- Configuration: Navigate to the netdata.conf file to configure your collectors. You can enable or disable specific collectors based on your monitoring needs.
- Collector Modules: Use Netdata’s collector modules to gather metrics. For example, you can use the python.d module for Python-based collectors, go.d for Go-based collectors, and more.
- Custom Dashboards: Create custom dashboards to visualize the metrics collected by your chosen collectors. This allows you to monitor all critical metrics in one place.
Examples Of Popular Collectors
Here are some examples of popular collectors in Netdata:
- MySQL: Monitor MySQL database performance, including query times, slow queries, and resource usage.
- nginx: Track the performance of your nginx web server, including request rates, response times, and error rates.
- Redis: Monitor Redis key-value store metrics, such as memory usage, hit rates, and command execution times.
- Docker: Collect metrics from Docker containers, including CPU usage, memory consumption, and network activity.
For a full list of available collectors and integrations, visit the Netdata Integrations page.
Implementing Observability With Netdata
Netdata is a powerful monitoring solution that provides real-time insights into your infrastructure’s performance. Here are some practical steps and examples for using Netdata to monitor your systems:
Creating Dashboards Netdata allows you to create custom dashboards to visualize the metrics that matter most to you. For example, you can create a dashboard that shows CPU, memory, disk I/O, and network traffic all in one view.
Alerts and Notifications Set up alerts and notifications to be informed about critical issues in real-time. Netdata supports various notification channels, including email, Slack, and PagerDuty.
Integrations Netdata integrates with many popular tools and platforms, such as Prometheus, Grafana, and Elasticsearch, allowing you to extend its capabilities and fit it into your existing monitoring stack.
Conclusion
Observability is essential for maintaining the health and performance of your infrastructure. By focusing on key metrics like CPU usage, memory usage, disk I/O, and network traffic, you can gain valuable insights into your system’s behavior. Netdata provides a comprehensive, real-time monitoring solution that helps you keep your infrastructure running smoothly.
For more detailed guides and examples, visit the Netdata Learn page.