When managing a website or web application through NGINX, it’s quite likely you’ve stumbled upon the feared 500 Internal Server Error at least once. This error often causes a moment of panic as it typically indicates a problem lurking within the server’s operations. Regrettably, one finds that the message falls short in offering sufficient context to aid in uncovering the underlying reason.
No need to fret! This guide is here to take you step by step through the usual culprits behind a 500 error when using NGINX and, even better, how to solve it. If you’re facing a problem like not having the right permissions, a setup mistake, or something different, don’t worry—we have all the steps you need to fix it.
What Causes the NGINX 500 Internal Server Error?
Before we dive into the fixes, let’s quickly go over some of the most common causes behind an NGINX 500 error:
File or Folder Permission Problems
NGINX may not be able to access the files it needs because of incorrect permissions.Bad NGINX Configurations
If yournginx.confor other configuration files have errors, NGINX won’t be able to function properly.Issues with PHP-FPM (for PHP Users)
PHP applications that use FastCGI (via PHP-FPM) could cause problems if misconfigured.File Upload Size Limits
Trying to upload files larger than NGINX’s default limits can also trigger this error.Third-Party Module Errors
Some external modules may not play nice with your current setup, leading to crashes.Backend Application Problems
Sometimes, the issue isn’t with NGINX but with the backend service (like Node.js or a Python app) that’s being proxied.
With that out of the way, let’s explore how to tackle these issues one by one.
How to Fix the NGINX 500 Internal Server Error
1. Start with the Logs
The first thing to do whenever you hit a 500 error is to check NGINX’s error logs. These logs usually give you a more detailed explanation of what went wrong. The default location for these logs is:
/var/log/nginx/error.log
2. Check File and Directory Permissions
If the log mentions “permission denied” or something similar, you might need to adjust the permissions on your files and directories. NGINX needs the right permissions to read and execute files.
- For directories:
755 - For files:
644
Here’s how to set them:
sudo chmod -R 755 /path/to/your/website
sudo chmod -R 644 /path/to/your/files
3. Test and Fix NGINX Configurations
Another common culprit is a broken or misconfigured nginx.conf file. NGINX provides a handy tool to test its configuration for errors before you reload or restart it. Run the following command:
sudo nginx -t
If NGINX reports any issues, it will tell you exactly where the problem is. Once you’ve made the necessary changes, reload the configuration with:
sudo systemctl reload nginx
4. Fix PHP-FPM (if You’re Running a PHP App)
If your website runs on PHP, you might be using PHP-FPM (FastCGI Process Manager) to handle requests. Sometimes, this service crashes or is incorrectly configured, causing a 500 error. Check the PHP-FPM error log:
Log location: /var/log/php-fpm/error.log
If you find anything suspicious, try fixing them and restart the service:
sudo systemctl restart phpX.Y-fpm
Make sure to replace phpX.Y-fpm with the actual version of PHP you’re using.
5. Increase File Upload Limits
If your 500 error pops up while trying to upload a large file, the issue might be with the client_max_body_size setting in NGINX. By default, NGINX limits file upload sizes, which could result in an internal server error if you exceed the limit.
To increase the file upload limit, open your NGINX configuration file and add this line (or modify the existing one):
client_max_body_size 100M;
This increases the limit to 100MB. You can adjust it based on your needs. After saving the file, reload NGINX:
sudo systemctl reload nginx
6. Temporarily Disable Third-Party Modules
Sometimes third-party modules are the culprit behind a 500 error. If you recently added or updated a module, try disabling it to see if the error goes away. To do this, open your configuration file and comment out the module directive by adding a # in front of it. Then, reload NGINX to apply the changes.
sudo systemctl reload nginx
If disabling the module fixes the issue, you may want to update it to the latest version or replace it with a more compatible version.
7. Check Backend Services (If You’re Using a Reverse Proxy)
If NGINX is acting as a reverse proxy for another application (like Node.js, Python, or Ruby on Rails), the issue might actually be with the backend rather than NGINX itself. Check your backend application’s logs to see if it’s throwing errors.
For example, if you’re using Node.js, check the console output for any uncaught exceptions or crashes. Fix the errors in your backend, restart it, and check if NGINX starts working again.
Monitor NGINX Performance in Real-Time
Netdata collects and displays real-time performance metrics from NGINX, which can help you understand what’s happening right before and during the 500 error. By keeping an eye on:
- HTTP request rates
- Response codes (including 500 errors)
- Active connections
- Bandwidth usage
You can quickly spot patterns or spikes in traffic that may have triggered the error. Netdata’s dashboard shows a timeline of events so you can correlate high load or traffic surges with the 500 error occurrences.
How to Use It:
- Open the Netdata dashboard and locate the NGINX section to monitor the current state of your server.
- Check the response codes chart to see the number of 500 errors in real-time.
- Examine resource usage, including CPU, memory, and disk I/O, which might be contributing factors if the server is overwhelmed.
Track Resource Usage and Bottlenecks
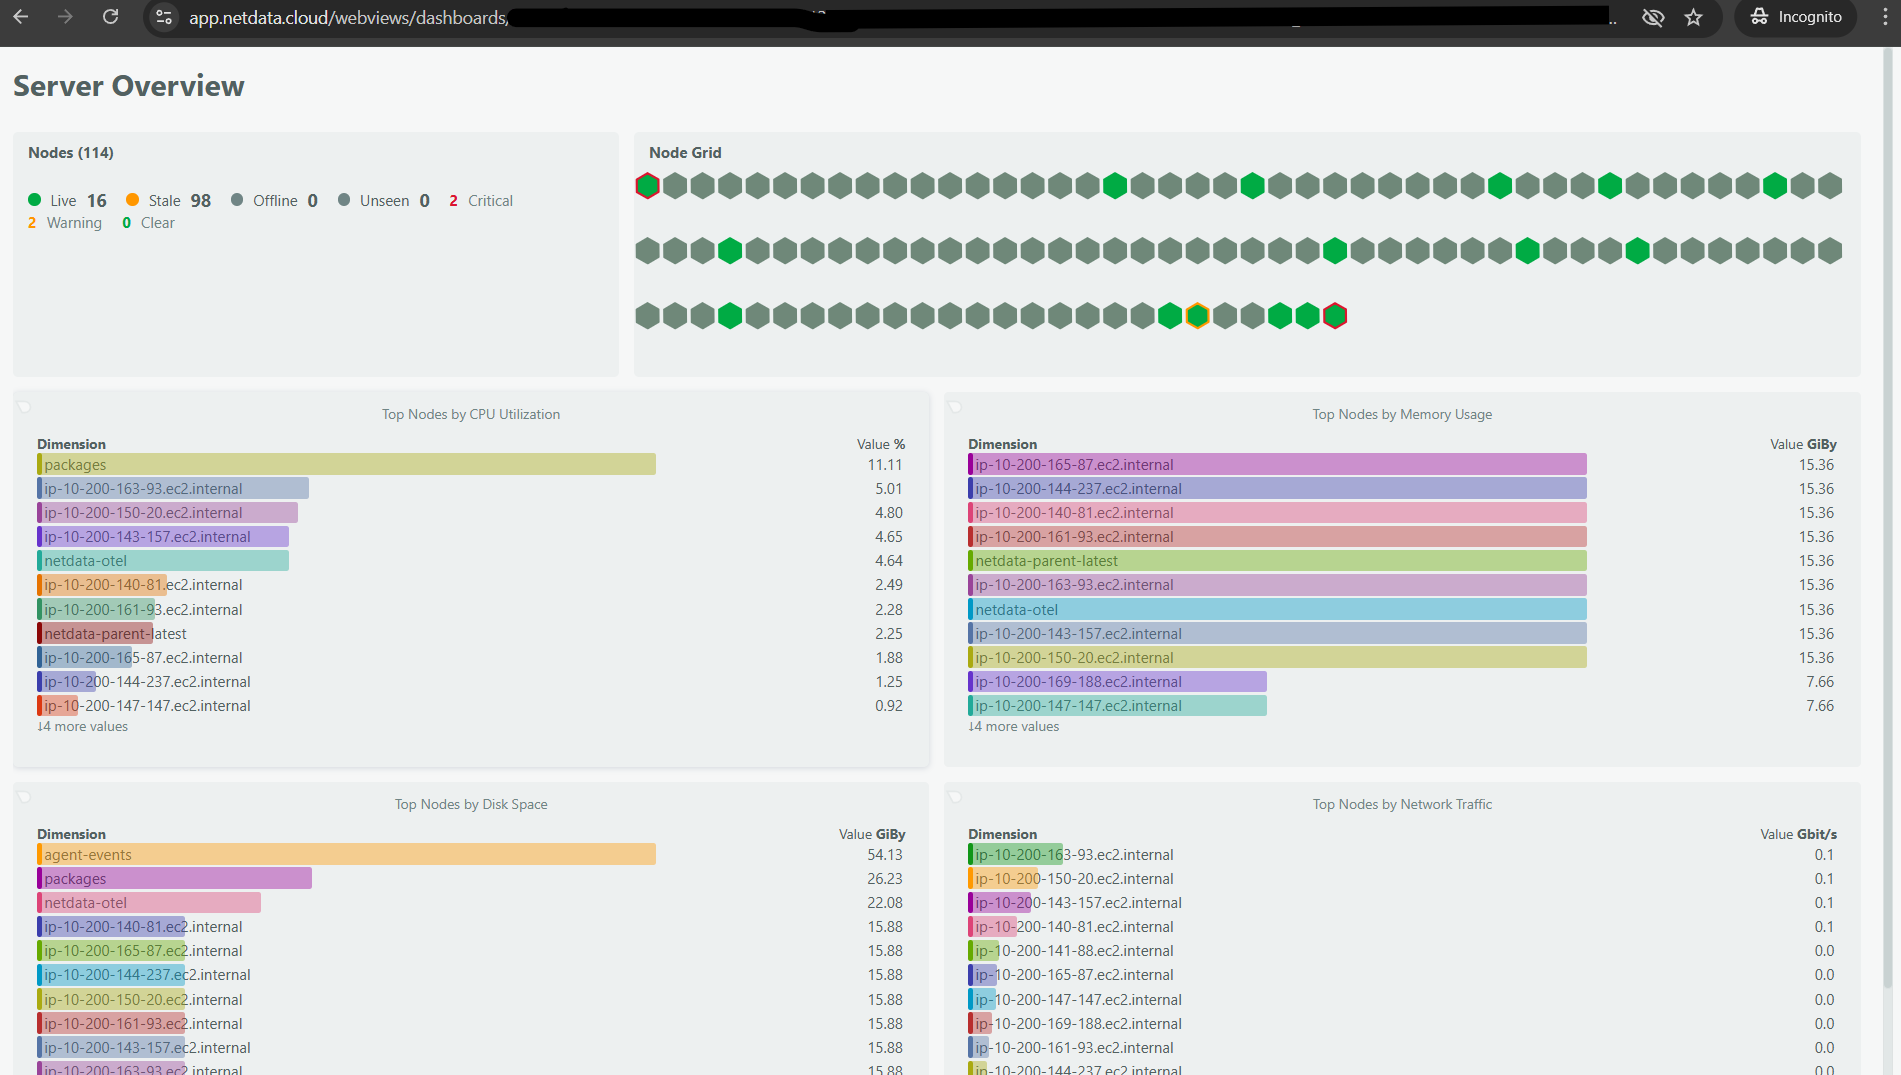
Sometimes, a 500 error occurs when your server runs out of resources like CPU, memory, or disk space. Netdata helps by tracking server resource utilization in real time, giving you insights into any potential bottlenecks.
- CPU spikes might indicate that NGINX or a backend service (e.g., PHP-FPM or Node.js) is overwhelmed.
- Memory leaks can cause services to crash, resulting in a 500 error.
- Disk space issues (especially on logs or temp files) could also disrupt normal server operations.
How to Use It:
- Look at the system performance metrics like CPU usage, memory, and disk I/O in the Netdata dashboard.
- Set up alerts in Netdata to notify you when certain thresholds are reached (e.g., CPU over 90% or disk space under 10%).
Identify PHP-FPM or Backend Issues
If you’re running a PHP-based website using PHP-FPM, Netdata can track PHP-FPM metrics, such as:
- Active workers
- Idle workers
- Slow requests
This allows you to see if PHP-FPM is running out of workers or getting overloaded, which could be the reason for the 500 error. Similarly, if NGINX is reverse-proxying to backend services like Node.js, Netdata can help track those services’ performance too.
How to Use It:
- Check the PHP-FPM section in the dashboard if you’re running a PHP-based app to see any bottlenecks or slow request spikes.
- Monitor your backend services (e.g., Node.js, Python, etc.) through custom plugins or service integrations available in Netdata.
View Error Logs and Correlate Events
Netdata allows you to monitor log files alongside performance data. This is useful because you can correlate server events (such as a traffic spike or a resource exhaustion) with entries in your NGINX error logs.
You can use Netdata’s log viewer to keep an eye on NGINX error logs in real time, helping you quickly identify what’s triggering the 500 error. You can set up Netdata to monitor /var/log/nginx/error.log and get notified when new errors are logged.
How to Use It: Enable log monitoring for the NGINX error log using Netdata. Set up custom alerts to notify you when a specific pattern (like the appearance of “500 Internal Server Error”) is detected.
Set Up Alerts and Notifications
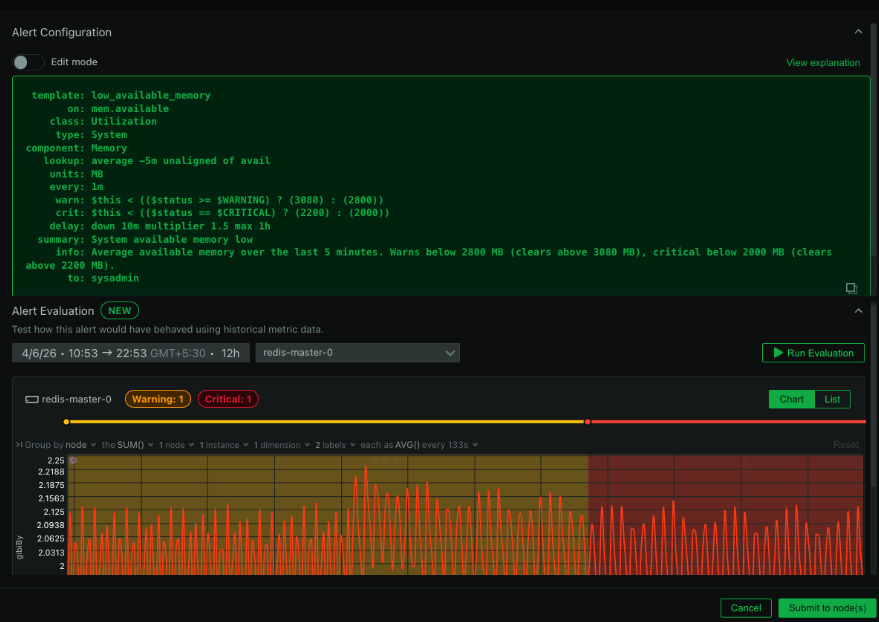
One of the most powerful features of Netdata is its alerting system. You can configure alerts for different NGINX metrics or system resource usage to get ahead of potential problems before they turn into 500 errors. For example:
- Set an alert for high 500 errors over a specific time period.
- Trigger notifications when CPU or memory usage exceeds safe limits.
- Get alerts if disk space is running low, which might prevent logs or cache from working properly. You can integrate these alerts with popular notification systems like Slack, email, or PagerDuty so that your team is immediately informed when something goes wrong.
How to Use It:
- Navigate to the Alerts section in Netdata and set custom thresholds for your server’s health metrics (e.g., HTTP 500 error spikes).
- Configure notification channels for instant alerts, reducing downtime.
Wrapping Up
Facing a 500 Internal Server Error in NGINX might seem like a mountain to climb. Yet taking one step at a time through the outlined troubleshooting methods will guide you to find and solve the issue. Dive into the task by first examining the logs. Make sure the settings are correct and remember the backend services especially if your setup includes a reverse proxy. Should the situation persist even after applying these solutions it could be the right moment to get in touch with your hosting service or explore the NGINX official guides for deeper insights. Wishing you all the best!


