Understanding Disk I/O Bottlenecks
Disk I/O (Input/Output) bottlenecks can severely impact the performance of your applications and services. These bottlenecks occur when the disk subsystem cannot keep up with the read/write requests from the CPU or memory, leading to slow response times and degraded performance. As a DevOps or SRE professional, understanding how to analyze and reduce these bottlenecks is crucial for maintaining optimal system health.
Identifying Disk I/O Bottlenecks
Before you can tackle disk I/O bottlenecks, you need to identify them accurately. Effective identification involves using a combination of monitoring tools and understanding key metrics.
Monitoring Tools
Tools like Netdata provide comprehensive, real-time insights into system performance, visualizing disk I/O operations, latency, and throughput. iostat and vmstat are command-line tools that report CPU and I/O statistics, offering a snapshot of system performance. dstat combines features of both, giving a detailed view of system performance.
Key Metrics to Watch
Several metrics are crucial for identifying disk I/O bottlenecks:
- IOPS (Input/Output Operations Per Second): High IOPS can indicate a busy disk.
- Latency: High latency suggests that I/O operations are taking longer to complete.
- Throughput: Measures the amount of data transferred per second. Low throughput might indicate a bottleneck.
- Utilization: High disk utilization percentage can point to a saturated disk.
By monitoring these metrics, you can pinpoint which disks are under stress and need attention.
Analyzing Disk I/O Bottlenecks
After identifying potential bottlenecks, analyzing the root causes is the next step. This involves examining factors that contribute to disk I/O performance, such as disk type and configuration, workload characteristics, and system configuration.
Disk Type and Configuration
The type of disk and its configuration play significant roles in performance. SSDs generally offer better performance than HDDs due to faster data access speeds. Additionally, the choice of RAID configuration (e.g., RAID 0, 1, 5, 10) impacts performance, redundancy, and capacity. The file system used (e.g., ext4, XFS, NTFS) also affects performance.
Workload Characteristics
Different applications have varying read/write patterns. For instance, databases might have more random I/O, while media servers might have more sequential I/O. Understanding the read/write ratio, block size, and concurrency levels is essential for identifying performance issues.
System Configuration
System settings can also impact I/O performance. Disk scheduling algorithms like CFQ (Completely Fair Queuing) and deadline scheduling influence how I/O operations are prioritized. Proper configuration of buffers and caches can reduce I/O load on disks, improving performance.
Reducing Disk I/O Bottlenecks
Once you’ve analyzed the bottlenecks, it’s time to implement strategies to mitigate them.
Optimize Workload Distribution
Distributing I/O load across multiple disks or servers prevents any single disk from becoming a bottleneck. For databases, sharding (splitting large databases into smaller pieces) helps distribute the I/O load.
Upgrade Hardware
Switching to SSDs can significantly reduce latency and increase IOPS. Increasing RAM allows more data to be cached in memory, reducing the frequency of disk I/O operations.
Fine-tune System Configuration
Choosing the right disk scheduling algorithm for your workload is crucial. For example, the deadline scheduler can be better for real-time applications. Using optimized file systems like XFS for large files and parallel I/O improves performance.
Improve Application Design
Ensure applications are designed to minimize unnecessary I/O operations. Batching I/O requests can reduce the number of disk accesses. Additionally, using asynchronous I/O allows applications to continue processing other tasks while waiting for I/O operations to complete.
Observability and Netdata
Implementing effective observability practices is key to proactively managing disk I/O bottlenecks. Tools like Netdata are invaluable in this process.
Real-time Monitoring with Netdata
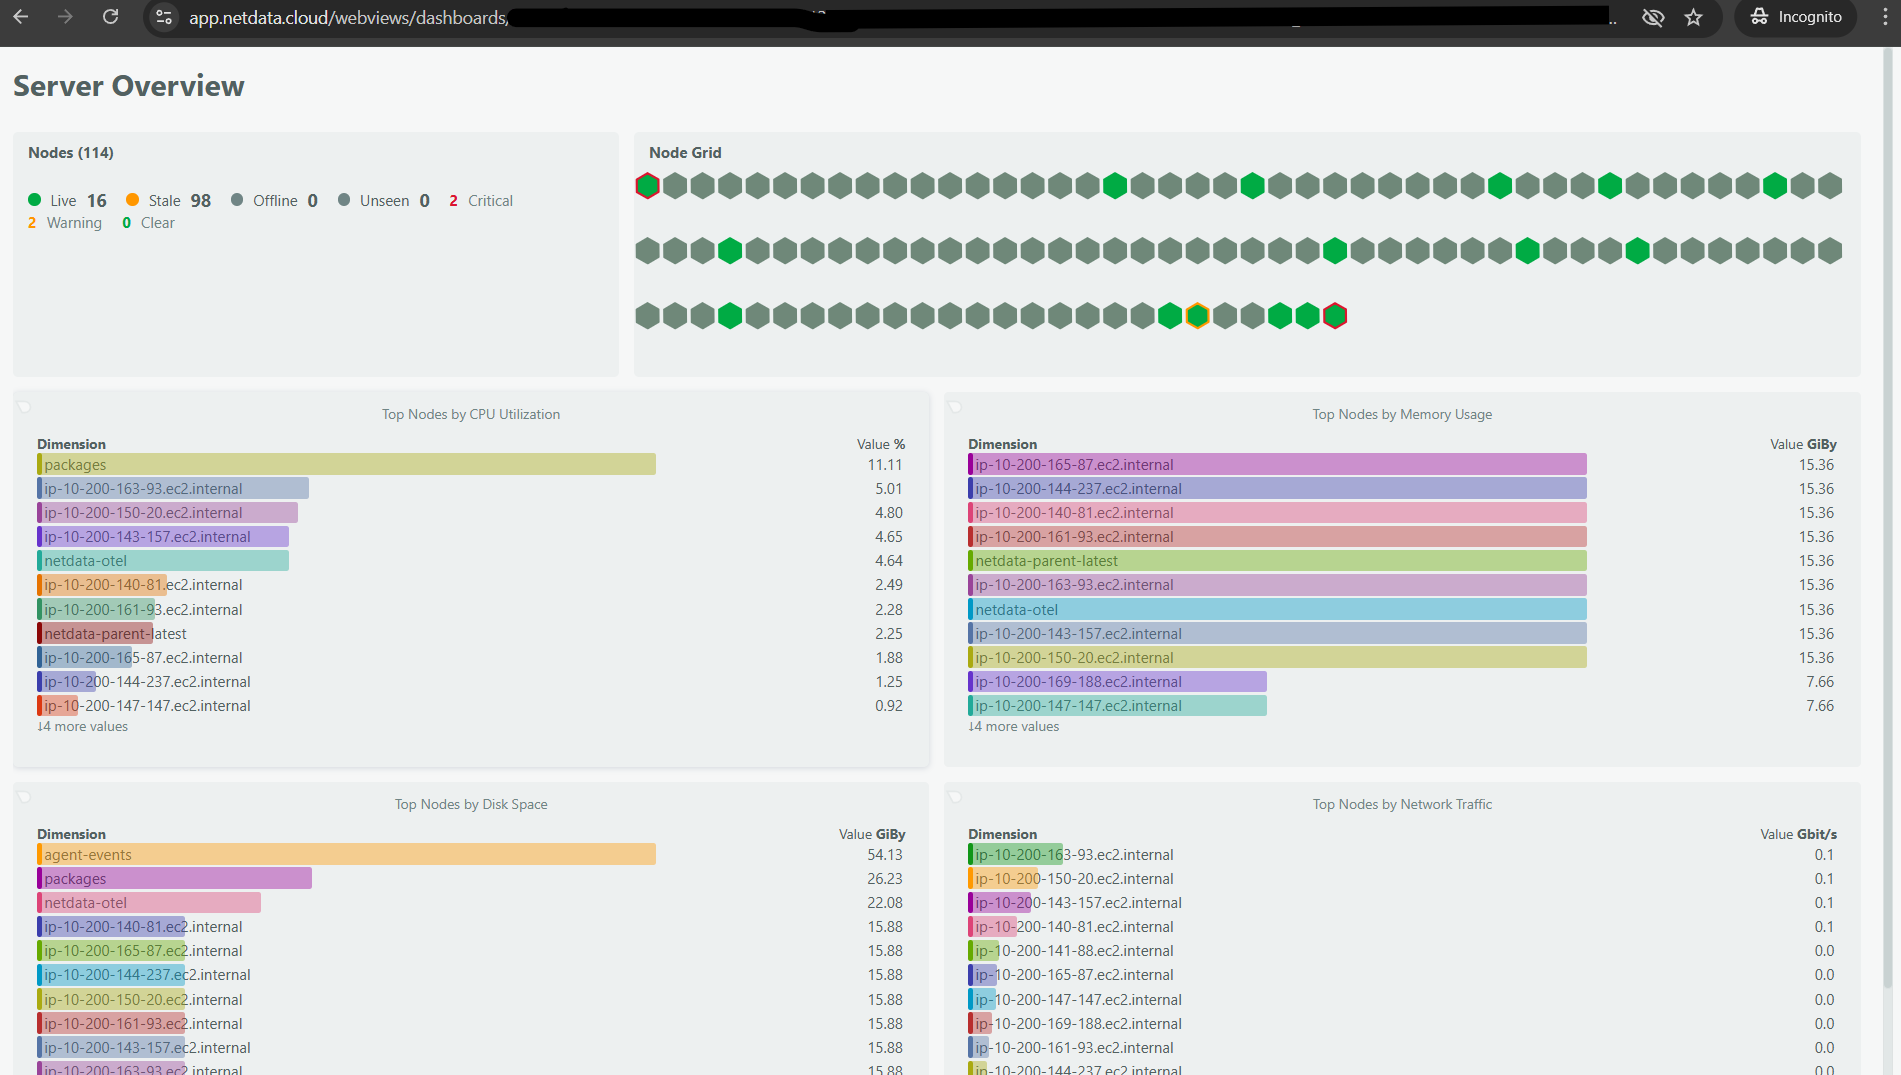
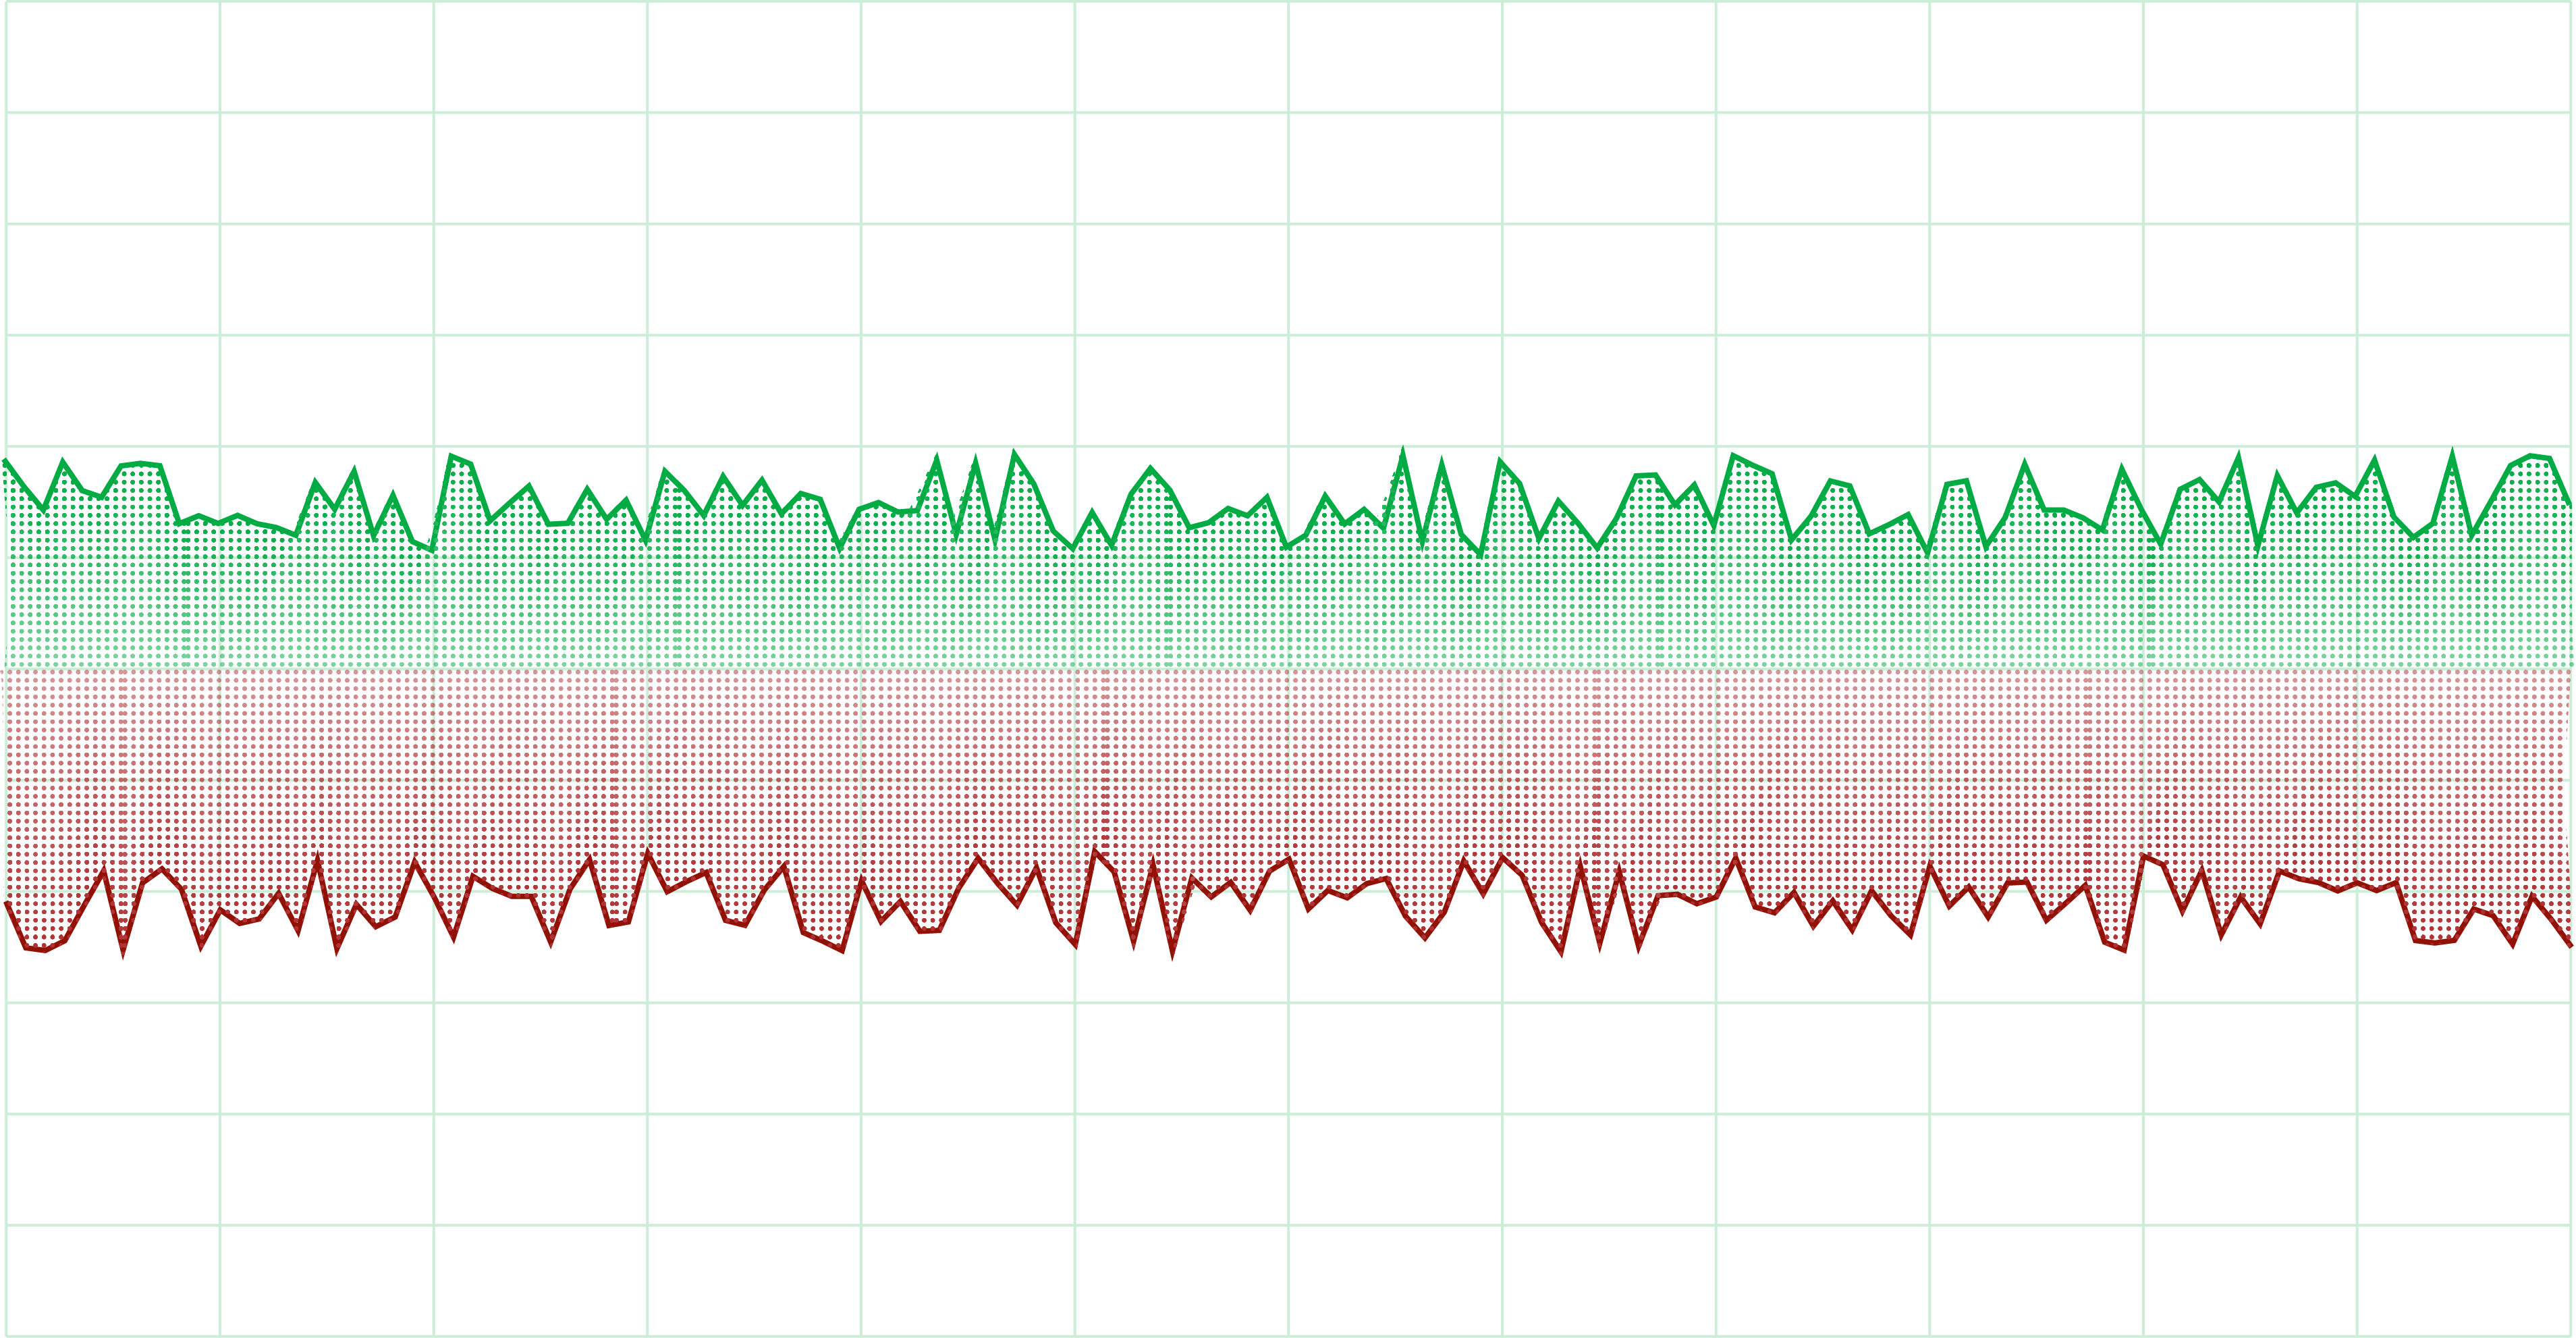
Netdata provides real-time visibility into your system’s performance, allowing you to monitor disk I/O metrics continuously. Its powerful dashboard displays critical metrics like IOPS, latency, and throughput, helping you quickly identify and address potential bottlenecks.
Setting Up Alerts
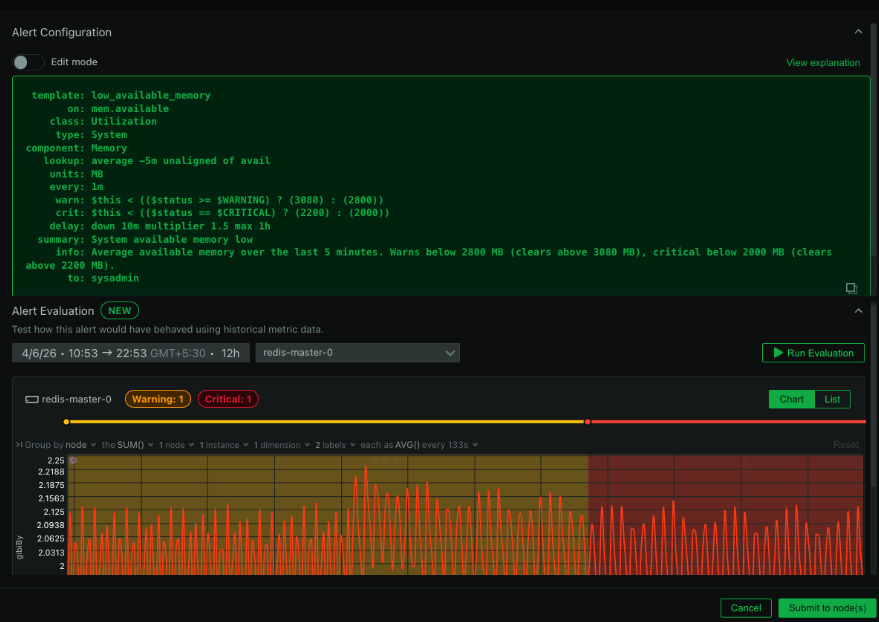
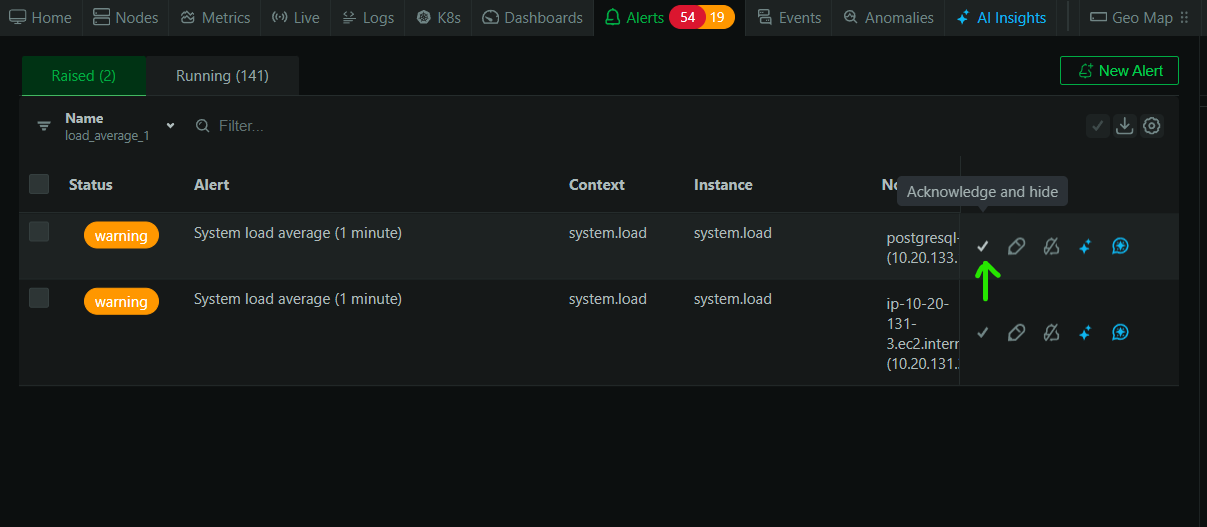
With Netdata, you can configure alerts to notify you of any unusual I/O patterns or performance degradation. This proactive approach ensures that you can address issues before they impact your users.
Detailed Insights and Trends
Netdata’s detailed charts and historical data analysis enable you to understand long-term trends in disk performance. By analyzing these trends, you can make informed decisions about when to upgrade hardware, optimize configurations, or balance workloads.
Integrating Netdata with Other Tools
Netdata can be integrated with other observability tools like PagerDuty, Grafana, Prometheus etc. allowing you to create a comprehensive monitoring and alerting system tailored to your needs.
By leveraging the power of Netdata, you can achieve a high level of observability, ensuring that your disk I/O performance remains optimal and your applications run smoothly.
In summary, understanding and mitigating disk I/O bottlenecks involves a combination of monitoring, analysis, and optimization techniques. By employing the strategies discussed in this article and leveraging tools like Netdata, you can maintain optimal disk performance and ensure the smooth operation of your applications and services. For further reading and resources, consider exploring the following:
By continually monitoring, analyzing, and optimizing your disk I/O, you’ll be well-equipped to handle any performance challenges that come your way.


