













What Is Infrastructure Monitoring?
Infrastructure monitoring is the practice of continuously tracking the performance, availability, and overall health of IT systems such as servers, databases, networks, cloud services and so many more. To put it simply, it’s about having clear visibility into how all the components of your applications and your entire infrastructure in general, are behaving. This is why we need and use the so-called monitoring / observability tools.
Monitoring tools or Observability tools are the ones that collect and analyze various metrics like CPU used, memory, disk activity, network traffic, and many others, thus giving you the information you need to understand your system’s performance and its operation properly. The goal is to identify issues before they even occur or before they cause bigger problems like downtime or performance degradation.
Use-case in practice: A sudden surge in CPU or memory usage is a case in point. It could be indicative of malfunctioning servers or applications. The monitoring tool you have chosen should detect this and alert you / your team. Being notified about the change, having a quick overview of your infrastructure’s metrics allows you to respond swiftly and prevent system failures that negatively affect users.
Key Areas Covered By Infrastructure Monitoring
Servers
Track CPU, memory, disk usage, and general system health.
Networks
Monitor bandwidth, latency, packet loss, and network traffic flow.
Databases
Analyze query times, connection numbers, and overall performance.
Cloud Services
Keep track of resource usage, health status, and billing metrics.
Other Applications
Monitor response times, error rates, and service availability.
Benefits Of Infrastructure Monitoring
Infrastructure monitoring is something that must be taken into account by all the organizations that depend on IT systems. A monitoring solution, in this connection, is not only a tool that allows to overcome problems but rather a preventive measure. It includes a reliability, security, and scalability check that makes the infrastructure functioning smooth. Here’s why monitoring should be a priority:
Prevent Downtime
Nothing is more disruptive than unexpected downtime. If there are any IT systems that go down, it means that the company becomes inefficient, it loses money and its reputation declines. To eliminate these kinds of interruptions, infrastructure monitoring is your first and best guess, since it marches you about the failed things. Once they are only starting to show signs, you will be alerted and easily find the issue. For example, the server which is almost at full capacity, a network switch that is giving up or a storage system that is full of data and will soon be rendered useless.
Optimize Performance
A well-monitored infrastructure allows you to see where performance bottlenecks might be occurring. For example, a database query that’s taking longer than expected or a server that’s constantly overloading. By having this visibility, you can optimize resource usage, reassign workloads, or upgrade hardware to improve the performance of your entire system.
Scale With Confidence
As your business grows, so does your infrastructure. Monitoring gives you the ability to track when your systems are reaching their limits and need to scale. Whether you’re adding more servers, increasing bandwidth, or upgrading storage, infrastructure monitoring gives you the data you need to scale proactively instead of reactively.
Control Costs
In environments like the cloud, where resource usage can fluctuate, it’s easy for costs to spiral out of control if you’re not paying attention. Infrastructure monitoring helps you track resource consumption and ensures that you’re not overpaying for services you’re not fully utilizing. Monitoring helps keep your infrastructure lean and cost-effective.
Ensure Compliance
Many industries require companies to meet strict compliance standards regarding data protection, system availability, and security. Infrastructure monitoring can help maintain compliance by providing logs, reports, and data on system uptime, performance, and security incidents, ensuring that your systems meet regulatory requirements.
Different Types Of IT Infrastructure Monitoring
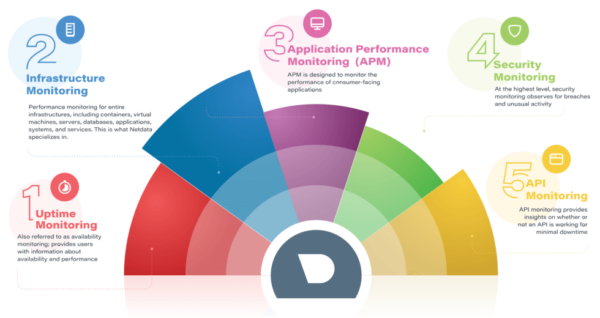
There are many kinds of monitoring available, from application to network to SNMP, which can blur the lines between what monitoring capabilities your company needs and what solution best fits your requirements. Monitoring tools help IT teams get better visibility into events, availability, capacity, and overall health and performance. With more visibility, teams are able to get alerted when an issue occurs, troubleshoot to restore service, analyze anomaly patterns, increase reliability by reducing outages, check resource utilization, and perform root cause analysis with historical data. The graphic below breaks down the main types of monitoring.
How To Choose The Right Monitoring Tool
Choosing the right tool for infrastructure monitoring is essential, as different tools offer various levels of detail, real-time capability, and customization options. The right monitoring tool should fit your infrastructure’s specific needs, providing a comprehensive view of your system’s health without adding complexity or performance overhead.
Why Real-Time Infrastructure Monitoring Is Essential
Real-time infrastructure monitoring provides the level of detail and immediacy that’s hard to find in other available enterprise-level tools. It’s not just about collecting metrics—it’s about having instant access to the information you need to make critical decisions about your infrastructure.
Key Challenges In Modern Infrastructure Monitoring
Often overlooked in monitoring is using real-time and historical data for troubleshooting infrastructure. Using legacy practices that focus on uptime entirely rather than adopting methods that include improving efficiency and performance will continue to widen gaps between IT and business leaders. Neglecting to find ways to optimize systems and increase agility will eventually lead to degradation of the product or service, affecting the business as a whole.
An effective approach for teams will involve troubleshooting via more granular metrics beyond measuring just resource consumption like CPU or memory utilization. All metrics should be available (without resorting to the command line) and can be critical in monitoring and troubleshooting health, performance, anomalies, and outages. A more comprehensive view will help prevent constant fire-fighting by helping IT teams identify underlying issues before they result in downtime. This is the impetus behind Netdata—a troubleshooting tool that zooms into the core of the operation of systems and applications.
Key Differences In Cloud Infrastructure Monitoring
Cloud infrastructure monitoring differs significantly from traditional on-premise monitoring. Instead of tracking static resources like physical servers and network switches, it focuses on dynamic assets, virtual machines, containers, and serverless functions that can be created or destroyed within seconds.
This dynamic nature requires tools that can automatically discover, track, and analyze short-lived resources. It also calls for deeper integration with cloud-native APIs offered by several platforms. These tools provide real-time insights into performance, cost, and usage across distributed services and regions.
Cloud monitoring must also support hybrid and multi-cloud architectures, where data and workloads are split across different environments. That makes central visibility and unified reporting essential.
Key differences include:
- Monitoring autoscaling and ephemeral resources
- Integrating with Kubernetes and container orchestration
- Focusing on usage-based performance and billing optimization
- Supporting rapid deployment cycles and CI/CD pipelines
Traditional infrastructure tends to be more predictable, but the cloud brings flexibility and scale, along with more complexity. Monitoring needs to evolve with it.
Importance Of Real-Time Infrastructure Monitoring
Real-time infrastructure monitoring is vital for any business that depends on uptime and performance. It helps detect problems the moment they happen, before they impact customers or cascade into larger failures.
Without real-time visibility, teams are left guessing. An unnoticed CPU spike, memory leak, or network bottleneck can cause severe slowdowns or outages. When monitoring runs continuously, it can trigger alerts, initiate automated recovery steps, or route incidents to the right teams immediately.
Real-time tools analyze metrics like disk I/O, bandwidth, application response times, and system load without delay. This enables teams to make informed decisions fast and prevent performance degradation.
For organizations working with high availability systems or strict SLAs, the benefits are clear:
- Shorter incident response times
- Reduced downtime and data loss
- Greater control over performance trends
- More predictable user experiences
Real-time infrastructure monitoring isn’t just a best practice, it’s a requirement for operational resilience.
Monitoring vs Logging In IT Infrastructure
Monitoring and logging are often mentioned together, but they serve very different functions. Monitoring tracks the health and performance of systems in real time, while logging captures a historical record of events and system activity.
Monitoring tells you what’s happening now. It collects data like CPU usage, network latency, or disk throughput, and alerts you if those values exceed thresholds. It’s about visibility, uptime, and proactive management.
Logging tells you what happened. It provides a chronological history of events, errors, warnings, user actions, and system changes. Logs are used during audits, post-incident investigations, or to trace security breaches.
Both are critical. Monitoring might show a spike in load time, while the logs reveal that a specific database query was the cause. When combined, they offer both the overview and the detail needed to diagnose and resolve complex issues.
How Infrastructure Monitoring Minimizes Downtime
Infrastructure monitoring plays a major role in reducing downtime and improving service reliability. It enables teams to spot issues early, long before they impact users or bring down entire systems.
By continuously tracking system health, monitoring tools detect warning signs such as CPU overload, memory saturation, or rising error rates. These insights allow teams to act fast and fix small problems before they escalate.
Modern platforms go a step further by automating responses. For example, if a service crashes, a monitoring tool can automatically restart it or trigger a failover to a healthy server. This kind of automation helps organizations respond in seconds, not hours.
Beyond immediate reactions, infrastructure monitoring also supports long-term reliability. It provides historical data to identify patterns and predict future issues. If performance consistently dips every Monday morning, teams can investigate and prepare accordingly.
Less downtime means:
- Happier customers and stronger retention
- Fewer support tickets and crisis escalations
- Better adherence to service-level agreements
- Reduced operational and financial risk
Monitoring doesn’t just show what’s broken, it prevents things from breaking in the first place.
Top Industries That Rely On Infrastructure Monitoring
Infrastructure monitoring is essential across many sectors, but some industries depend on it more than others due to high availability needs, regulatory pressures, or real-time service expectations.
In finance, even seconds of downtime can impact transactions and breach compliance requirements. Monitoring is critical to ensuring continuous operation, especially in trading platforms or digital banking apps.
Healthcare organizations use monitoring to keep life-critical systems online, like electronic health records, diagnostic devices, or telemedicine platforms. Any failure here can put patient care at risk.
SaaS and e-commerce platforms rely on always-on infrastructure to serve users across time zones. A slow checkout or unavailable dashboard can lead to revenue loss or churn. Infrastructure monitoring helps keep user experiences smooth and consistent.
Telecom providers must maintain fast, reliable networks. Monitoring enables them to detect outages, track traffic spikes, and resolve service interruptions quickly.
In logistics and transportation, real-time data powers everything from inventory to fleet tracking. Monitoring keeps these systems responsive and helps optimize performance across the supply chain.
Industries that rely most on infrastructure monitoring include:
- Finance and banking
- Healthcare and medical tech
- SaaS and cloud services
- E-commerce and retail
- Telecommunications
- Logistics and supply chain
No matter the vertical, if performance, security, and uptime matter, monitoring is non-negotiable.
Why Choose Netdata For Infrastructure Monitoring
When it comes to selecting an infrastructure monitoring tool that offers both depth and simplicity, Netdata stands out. Here’s why Netdata could be the ideal choice for your organization:
Real-Time Monitoring
Netdata is designed to provide real-time visibility into your systems. Unlike tools that might update metrics every minute or every few minutes, Netdata continuously collects and visualizes data in real-time, so you’re never left guessing. You get an immediate view of what’s happening across your infrastructure, which is crucial for identifying and resolving problems quickly. For example, if a server suddenly spikes in CPU usage, you can see the exact second it happened. This granularity allows you to trace issues faster and with greater accuracy.
Low Overhead
Monitoring should never put a strain on your systems, and that’s where Netdata shines. It’s engineered to be lightweight, collecting thousands of metrics per second adding near - zero load to your infrastructure. Whether you’re monitoring a single server or a fleet of them, Netdata runs smoothly in the background, allowing you to gather critical data without affecting your system’s performance.
Simple Installation & Intuitive Interface
Unlike some monitoring tools that require complex setup processes and configurations, Netdata is easy to install and get running in minutes. Once installed, you’re presented with an intuitive dashboard that visually represents the health of your systems. The interface is clean, making it simple to understand what’s happening, even if you’re new to monitoring tools.
Comprehensive Coverage Across Your Stack
Netdata offers broad coverage of your infrastructure, from servers and containers to network devices and applications. This means you can monitor everything from hardware metrics to software performance in one place. No need to juggle multiple tools for different parts of your stack—Netdata gives you full visibility across your entire infrastructure.
Customizable Alerts
Netdata comes with a flexible alerting system that allows you to set customized thresholds for key metrics, easily, directly from the UI. Whether you want to be notified when disk space runs low, CPU usage exceeds a certain percentage, or network latency spikes, Netdata will alert you before things go wrong. These alerts are actionable, helping you stay ahead of issues before they escalate into larger problems.