


As businesses rely more on infrastructure monitoring, observability tools have become essential for keeping systems secure, responsive, and efficient. In this evolving monitoring landscape, Datadog is known as a leading analytics and monitoring tool, capable of collecting essential performance metrics from servers, databases, applications, and other IT infrastructures. But at what cost?
What Is Datadog? Is It Your Only Option?
Datadog is a cloud-based monitoring platform that helps organizations track the performance of their infrastructure, applications, and logs. It provides visibility across systems to ensure efficient operations and identify issues quickly.
However, for many, Datadog’s complex SKU-based and data volume pricing method results in a significant—and often unpredictable monthly bill. While Datadog offers great value, many companies are now asking, are there other reliable options at a better price point?
Whether you’re an enterpise looking to cut down costs or a startup with a limited budget, these five options offer great features at a lower cost.
Why Switch To Datadog Competitors?
While Datadog is a powerful tool for infrastructure monitoring, it may not be the best fit for every organization due to several key factors:
High Pricing & Unpredictable Costs
Datadog’s pricing structure is based on usage metrics, logs, and traces, which can skyrocket as your infrastructure grows.
Many users experience unexpected overages, making it difficult to budget for long-term use.
Competitors like Netdata, Prometheus, and Zabbix offer more cost-effective solutions, with some even being free and open-source.
Performance Concerns
While Datadog provides rich observability features, users report that dashboards can lag when processing large datasets.
High telemetry costs and slow query response times make alternatives like Prometheus + Grafana more attractive for teams requiring faster performance analytics.
Complex Configuration & Learning Curve
Datadog’s extensive features can make it overwhelming for new users.
Some businesses prefer simpler, lightweight monitoring tools like Netdata, which offers plug-and-play installation with minimal setup time.
Need For More Customization & Flexibility
While Datadog is a great all-in-one solution, it may lack deep customization compared to open-source alternatives.
Other solutions allow users to fine-tune alerts, integrations, and custom metrics, giving them greater control over monitoring needs.
What Features To Consider When Choosing A Datadog Alternative
Selecting the best Datadog competitor depends on your business needs, infrastructure size, and budget. Here are the key factors to evaluate:
Real-Time Monitoring & Alerting
Ensure that the alternative provides real-time visibility into infrastructure metrics like CPU, memory, network usage, and disk I/O.
Look for customizable alerting systems that notify your team instantly when anomalies occur.
Scalability For Growing Infrastructures
If your infrastructure expands, you need a monitoring solution that scales efficiently without massive cost increases.
Netdata, New Relic, and Dynatrace offer enterprise-grade scalability to handle thousands of servers and containers.
Log Management & Distributed Tracing
For large-scale applications, having log correlation and distributed tracing is essential for troubleshooting performance issues.
Elastic Stack (ELK) and New Relic provide powerful log analytics, making them strong Datadog alternatives.
Cost Efficiency & Open-Source Flexibility
If budget constraints are an issue, consider Netdata, which offers free and open-source monitoring solutions.
Usage-based pricing options from competitors like New Relic can also be more predictable.
Ease Of Deployment & Integration
If you want a fast and simple setup, look for agent-based monitoring tools that require minimal configuration.
Netdata, for example, provides one-click installation and preconfigured dashboards, reducing the need for manual setup.
Netdata
Best for: Real-time performance monitoring (1 second granularity) Price: Free community plan; paid cloud plans start from $4.5/node/month and reduces with volume discounts
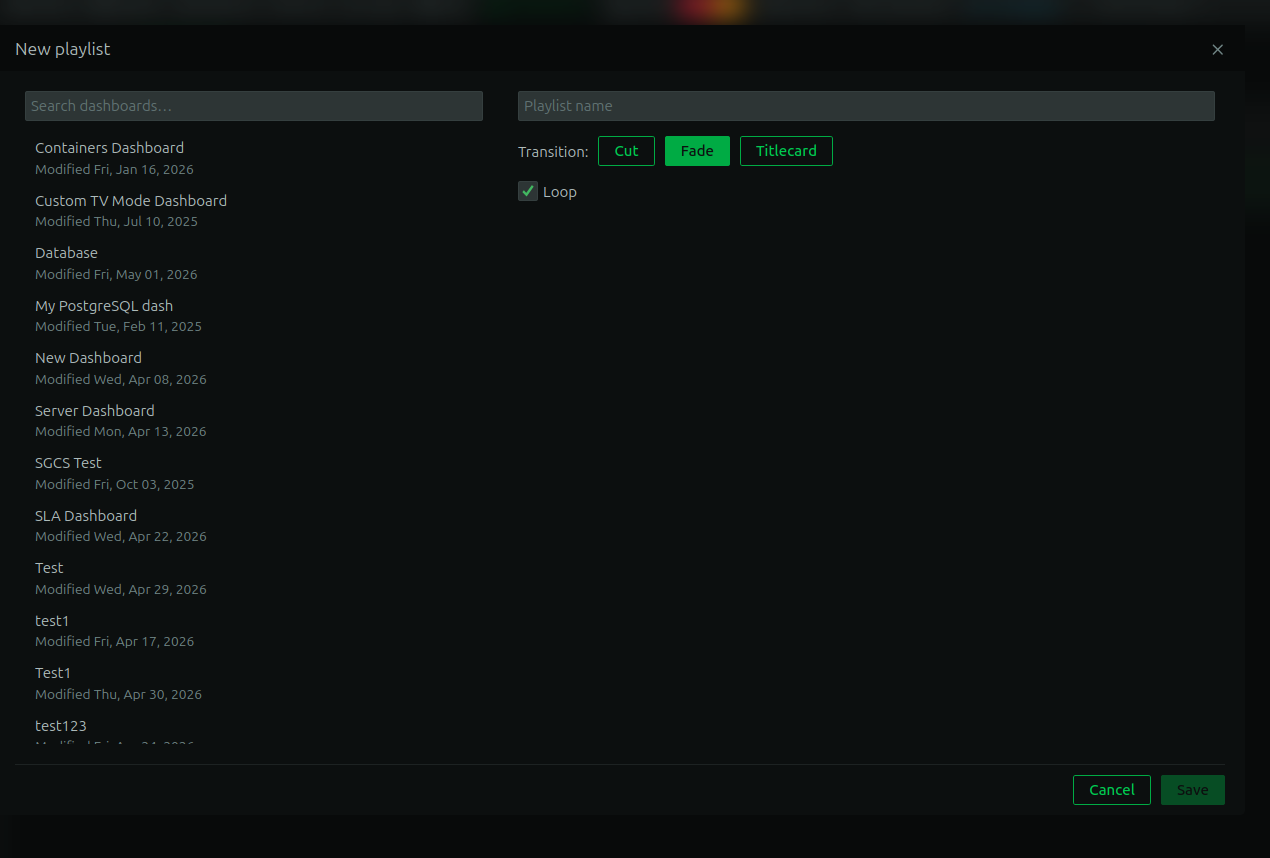
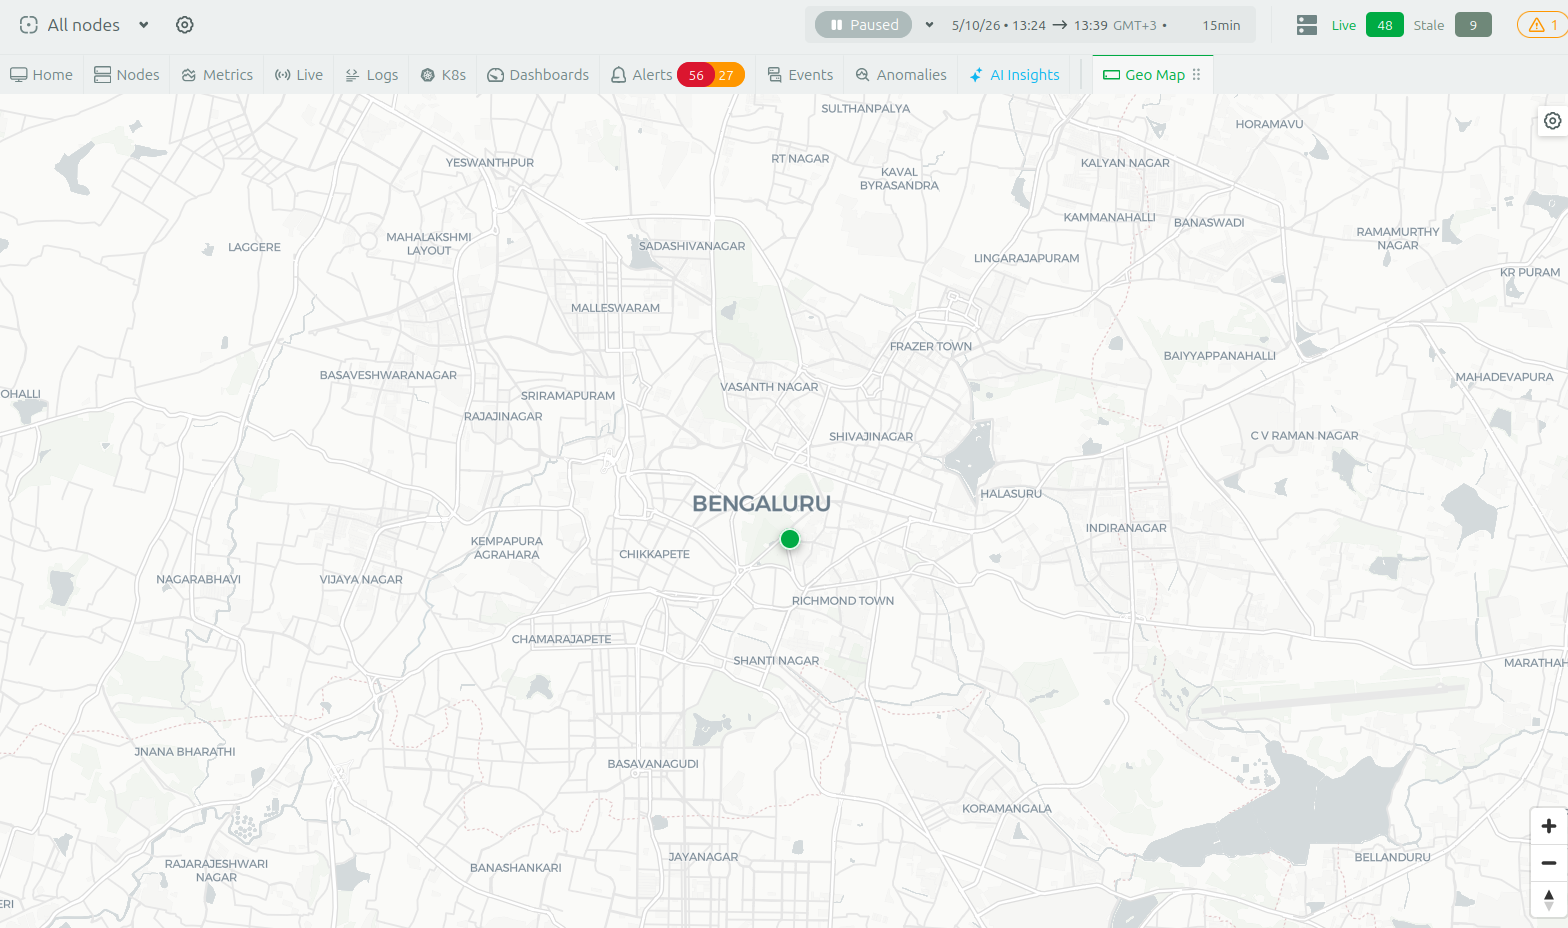
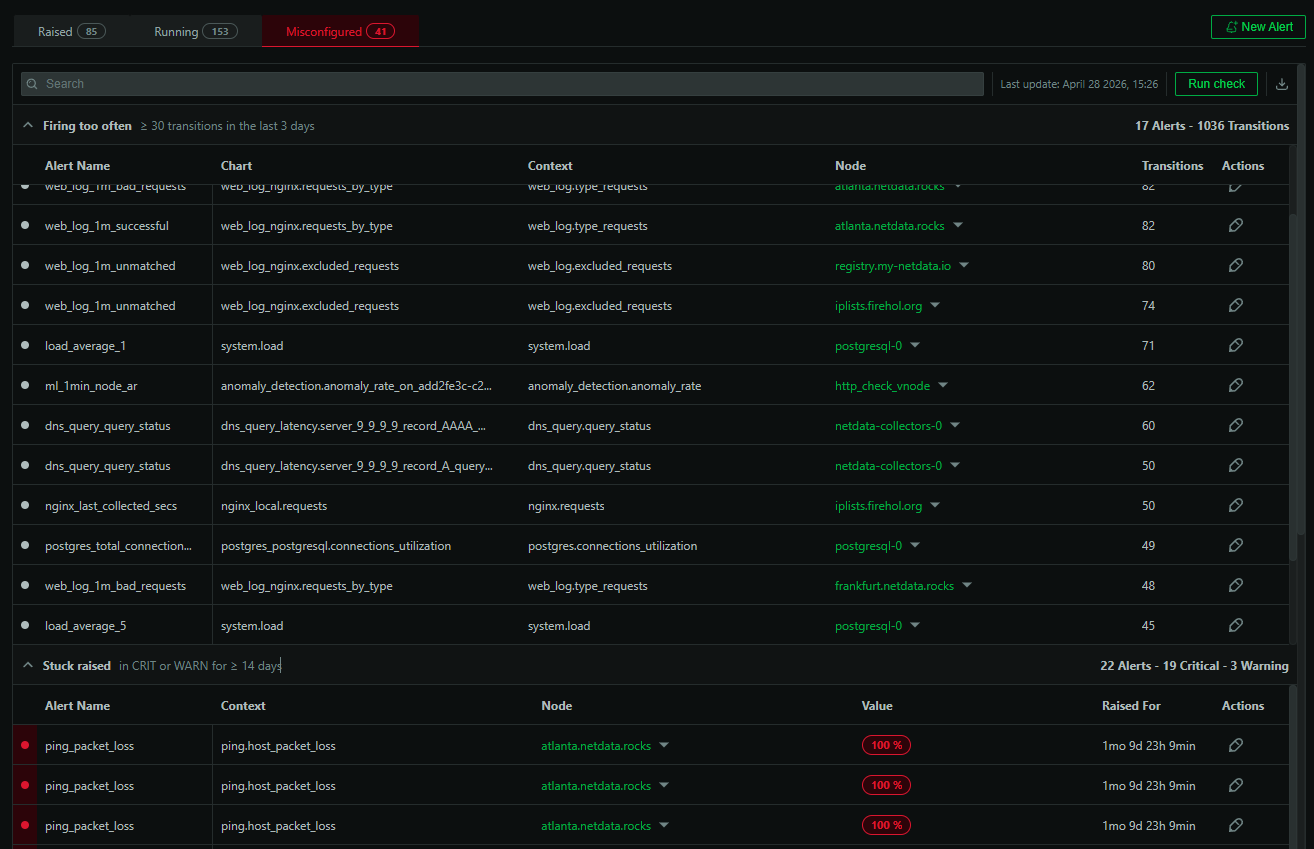
Why choose Netdata? Netdata aims to streamline and enhance IT operations by offering high-fidelity data, real-time visualizations, and dependable alerts, along with anomaly detection for every metric. Netdata provides a a lot of value out-of-the-box and it can be set up in a matter of minutes (YT Link). Once installed, users gain access to thousands of metrics displayed on hundreds, out-of-the-box, interactive charts that refresh every second.
Netdata automatically detects and collects all available metrics, since it supports 800+ integrations, and is designed for engineers to have a comprehensive view immediately after installation.
Pros
- Real time performance monitoring with 1-second granularity.
- Low maintenance: Automatically detects and collects metrics without manual setup.
- Comprehensive monitoring: Tracks every single metric, offering extensive observability.
- Instant troubleshooting: No need to create new dashboards, real-time data is available immediately.
- Transparent pricing: Flat rate per node with no hidden costs.
- Quick setup: Can be deployed and ready for use within minutes.
Cons
- APM: Lacks built-in APM functionality, but by using Prometheus Exporter it offers dashboards that visualize the APM metrics it can collect.
- Can seem overwhelming for new users: Monitoring every metric can be confusing at first due to the extensive amount of data provided.
Prometheus + Grafana
Best for: Custom visualizations Price: Free (Open-source) with various premium options
Why choose Prometheus + Grafana? Prometheus and Grafana stack offers a highly customizable, open-source solution for monitoring and visualization, making them ideal for teams that need control and flexibility. Prometheus excels at collecting and managing time-series data at scale, while Grafana enables dynamic, interactive visualizations tailored to your specific needs.
This combo is perfect for developers who want granular control and customization over their monitoring setup. It’s a great alternative for those with the technical capacity to implement and maintain the setup, delivering high functionality at no cost (other than their time).
Pros
- Cost-effective: Completely free if using the open-source version of Grafana, making it an attractive option for teams with tight budgets.
- Highly customizable visualizations: You can create detailed and specific dashboards tailored exactly to your needs, provided you have a clear understanding of what you’re looking to visualize.
- Scalable for time-series data: Prometheus excels at collecting large-scale time-series data, making it a good option for complex infrastructure monitoring.
Cons
- Long setup time: Setting up and configuring Prometheus and Grafana can be time-consuming, with a steep learning curve, especially for less experienced teams.
- Requires expertise: You need to have a solid technical understanding to manage, maintain, and customize the setup effectively.
- Not real-time: The stack may not offer real-time monitoring out of the box, which can be a drawback in fast-paced environments.
- High maintenance: Ongoing management and upkeep can be resource-intensive, requiring continuous attention to ensure smooth operation.
- Challenging in crisis situations: If dashboards aren’t pre-configured for specific failure scenarios, it can be difficult to diagnose and resolve issues quickly during an emergency.
Zabbix
Best for: Monitoring across IT infrastructure Price: Free for self-hosted; Paid plans for managed services
Why choose Zabbix? Zabbix provides an all-in-one monitoring solution that covers networks, servers, virtual machines, and cloud resources. It provides extensive alerting, visualization, and integrations, at a fraction of the cost of Datadog. The self-hosted version is free, making it quite attractive to businesses that want to monitor their infrastructure without ongoing subscription costs.
Pros
- Comprehensive monitoring: Zabbix provides an all-in-one solution that covers a wide range of IT infrastructure, including networks, servers, virtual machines, and cloud resources, offering broad visibility across your tech stack.
- Extensive integrations: Zabbix offers a variety of integrations with third-party tools and systems, allowing for seamless connectivity across your existing IT environment.
- Customizable alerts and dashboards: Zabbix provides detailed and configurable alerts and dashboards, allowing teams to tailor the monitoring system to fit their unique needs.
Cons
- Steep learning curve: Zabbix can be challenging to master, especially for teams that are new to infrastructure monitoring or don’t have prior experience with complex tools.
- Difficult to manage: Managing Zabbix, particularly in larger environments, can be overwhelming without sufficient expertise or resources.
- Customization requires scripting: To fully customize Zabbix to your specific needs, you’ll need to know scripting, adding an extra layer of complexity for teams without coding knowledge.
- No real-time monitoring: Zabbix doesn’t offer real-time monitoring, which can be a drawback for environments that require instant data and alerts.
Elastic Observability (ELK Stack)
Best for: Log management and search Price: Free (Open-source for self-hosted); Managed services start from $95/month
Why choose Elastic for Observability? The Elastic Stack (Elasticsearch, Logstash, and Kibana) is widely known for log management, search, and analytics, but it also offers a broader observability solution. Elastic Observability offers monitoring for logs, metrics, and traces, with real-time search capabilities. It’s particularly attractive for businesses that already use the ELK stack, as they can extend its functionalities without large additional costs.
Pros
- Strong log management and search capabilities: The ELK Stack is well-known for its powerful log management and real-time search features, making it ideal for handling vast amounts of log data.
- Cost-effective for self-hosted: The open-source version is free for businesses that want to self-host, offering a high level of functionality without large ongoing costs.
- Customizable visualizations: Kibana offers rich, customizable visualizations and dashboards that can be tailored to specific monitoring needs.
- Seamless integration: Particularly advantageous for businesses already using the ELK stack, as they can extend their existing setup for observability without substantial new investment.
Cons
- Resource-intensive setup: Setting up and maintaining a self-hosted ELK Stack can be complex and resource-heavy, especially for smaller teams.
- Scaling challenges: As data volume grows, scaling the ELK Stack effectively can become complicated and costly in terms of infrastructure.
- High storage costs: Log and data storage can get expensive, particularly for large datasets, unless carefully managed.
- Steep learning curve: Mastering Elasticsearch queries and configuring the stack for optimal performance requires a certain level of expertise.
- Not out-of-the-box & no real-time monitoring: While search is real-time, setting up and maintaining real-time monitoring for metrics and traces may take extra configuration.
New Relic
Best for: Full-stack observability Price: Starts at $0.35/GB after the free limit
Why choose New Relic? New Relic is an observability platform designed to help developers, engineers, and IT professionals monitor their applications, infrastructure, and digital experiences in real time. New Relic offers real, actionable insights into your tech stack, allowing you to troubleshoot infrastructure issues before they impact performance. With dashboards, alerts, and integrations, it streamlines monitoring and observability. It uses over 750 integrations, hundreds of tools and open standards, making setup fast and efficient.
Pros
- Full-stack observability: New Relic provides comprehensive monitoring across your entire tech stack, including applications, infrastructure, and user experiences, making it a one-stop solution for observability needs.
- Extensive integrations: New Relic supports over 750 integrations, making it easy to integrate your systems.
- Usage-based pricing: If you have a small setup with low volumes of data, their price can be quite fair.
- Intuitive dashboards and alerts: New Relic’s customizable dashboards and alerting system allow teams to monitor the most relevant data points, improving observability and decision-making efficiency.
Cons
- Cost can add up for high data volumes: While the pricing model is flexible, costs can quickly increase for businesses with large data volumes or extensive monitoring needs.
- Steep learning curve for advanced features: Though the interface is user-friendly, mastering all of New Relic’s features, particularly its advanced capabilities, may require significant training and expertise.
- Limited free tier: The free tier offers limited data retention and functionality, which may not be enough for businesses with more complex monitoring needs.
- Resource-intensive: Like many full-stack observability platforms, New Relic can be resource-intensive in terms of infrastructure and system overhead, especially in large environments.
- Some features locked behind higher tiers: Certain advanced features and premium support options are only available at higher pricing tiers, which might not suit smaller businesses or those with tight budgets.
Wrapping up, we’ve explored five great alternatives to Datadog, each with unique strengths. Whether it’s the real-time simplicity of Netdata, the flexibility of Prometheus + Grafana, Zabbix’s all-in-one approach, Elastic’s log management, or New Relic’s full-stack coverage, there’s an option for every need and budget.
Netdata’s ease of use and real-time insights are a standout worth considering as you look for more cost effective monitoring in 2025. Contact us to learn more!