The only agent that thinks for itself

Autonomous Monitoring with self-learning AI built-in, operating independently across your entire stack.

Unlimited Metrics & Logs
Machine learning & MCP
5% CPU, 150MB RAM
3GB disk, >1 year retention
800+ integrations, zero config
Dashboards, alerts out of the box
> Discover Netdata Agents
Centralized metrics streaming and storage

Aggregate metrics from multiple agents into centralized Parent nodes for unified monitoring across your infrastructure.

Stream from unlimited agents
Long-term data retention
High availability clustering
Data replication & backup
Scalable architecture
Enterprise-grade security
> Learn about Parents
Fully managed cloud platform

Access your monitoring data from anywhere with our SaaS platform. No infrastructure to manage, automatic updates, and global availability.

Zero infrastructure management
99.9% uptime SLA
Global data centers
Automatic updates & patches
Enterprise SSO & RBAC
SOC2 & ISO certified
> Explore Netdata Cloud
Deploy Netdata Cloud in your infrastructure

Run the full Netdata Cloud platform on-premises for complete data sovereignty and compliance with your security policies.

Complete data sovereignty
Air-gapped deployment
Custom compliance controls
Private network integration
Dedicated support team
Kubernetes & Docker support
> Learn about Cloud On-Premises
Powerful, intuitive monitoring interface

Modern, responsive UI built for real-time troubleshooting with customizable dashboards and advanced visualization capabilities.

Real-time chart updates
Customizable dashboards
Dark & light themes
Advanced filtering & search
Responsive on all devices
Collaboration features
> Explore Netdata UI
Monitor on the go

Native iOS and Android apps bring full monitoring capabilities to your mobile device with real-time alerts and notifications.

iOS & Android apps
Push notifications
Touch-optimized interface
Offline data access
Biometric authentication
Widget support
> Download apps

Best energy efficiency

True real-time per-second

100% automated zero config

Centralized observability

Multi-year retention

High availability built-in

Zero maintenance

Always up-to-date

Enterprise security

Complete data control

Air-gap ready

Compliance certified

Millisecond responsiveness

Infinite zoom & pan

Works on any device

Native performance

Instant alerts

Monitor anywhere

80% Faster Incident Resolution
AI-powered troubleshooting from detection, to root cause and blast radius identification, to reporting.
True Real-Time and Simple, even at Scale
Linearly and infinitely scalable full-stack observability, that can be deployed even mid-crisis.
90% Cost Reduction, Full Fidelity
Instead of centralizing the data, Netdata distributes the code, eliminating pipelines and complexity.
Control Without Surrender
SOC 2 Type 2 certified with every metric kept on your infrastructure.
Integrations

800+ collectors and notification channels, auto-discovered and ready out of the box.

800+ data collectors
Auto-discovery & zero config
Cloud, infra, app protocols
Notifications out of the box
> Explore integrations
Real Results
46% Cost Reduction

Reduced monitoring costs by 46% while cutting staff overhead by 67%.

— Leonardo Antunez, Codyas

Zero Pipeline

No data shipping. No central storage costs. Query at the edge.

From Our Users
"Out-of-the-Box"

So many out-of-the-box features! I mostly don't have to develop anything.

— Simon Beginn, LANCOM Systems

No Query Language

Point-and-click troubleshooting. No PromQL, no LogQL, no learning curve.

Enterprise Ready
67% Less Staff, 46% Cost Cut

Enterprise efficiency without enterprise complexity—real ROI from day one.

— Leonardo Antunez, Codyas

SOC 2 Type 2 Certified

Zero data egress. Only metadata reaches the cloud. Your metrics stay on your infrastructure.

Full Coverage
800+ Collectors

Auto-discovered and configured. No manual setup required.

Any Notification Channel

Slack, PagerDuty, Teams, email, webhooks—all built-in.

Built for the People Who Get Paged
Because 3am alerts deserve instant answers, not hour-long hunts.
Every Industry Has Rules. We Master Them.
See how healthcare, finance, and government teams cut monitoring costs 90% while staying audit-ready.
Monitor Any Technology. Configure Nothing.
Install the agent. It already knows your stack.
From Our Users
"A Rare Unicorn"

Netdata gives more than you invest in it. A rare unicorn that obeys the Pareto rule.

— Eduard Porquet Mateu, TMB Barcelona

99% Downtime Reduction

Reduced website downtime by 99% and cloud bill by 30% using Netdata alerts.

— Falkland Islands Government

Real Savings
30% Cloud Cost Reduction

Optimized resource allocation based on Netdata alerts cut cloud spending by 30%.

— Falkland Islands Government

46% Cost Cut

Reduced monitoring staff by 67% while cutting operational costs by 46%.

— Codyas

Real Coverage
"Plugin for Everything"

Netdata has agent capacity or a plugin for everything, including Windows and Kubernetes.

— Eduard Porquet Mateu, TMB Barcelona

"Out-of-the-Box"

So many out-of-the-box features! I mostly don't have to develop anything.

— Simon Beginn, LANCOM Systems

Real Speed
Troubleshooting in 30 Seconds

From 2-3 minutes to 30 seconds—instant visibility into any node issue.

— Matthew Artist, Nodecraft

20% Downtime Reduction

20% less downtime and 40% budget optimization from out-of-the-box monitoring.

— Simon Beginn, LANCOM Systems

Pay per Node. Unlimited Everything Else.

One price per node. Unlimited metrics, logs, users, and retention. No per-GB surprises.

Free tier—forever
No metric limits or caps
Retention you control
Cancel anytime
> See pricing plans
What's Your Monitoring Really Costing You?

Most teams overpay by 40-60%. Let's find out why.

Expose hidden metric charges
Calculate tool consolidation
Customers report 30-67% savings
Results in under 60 seconds
> See what you're really paying
Your Infrastructure Is Unique. Let's Talk.

Because monitoring 10 nodes is different from monitoring 10,000.

On-prem & air-gapped deployment
Volume pricing & agreements
Architecture review for your scale
Compliance & security support
> Start a conversation
Monitoring That Sells Itself

Deploy in minutes. Impress clients in hours. Earn recurring revenue for years.

30-second live demos close deals
Zero config = zero support burden
Competitive margins & deal protection
Response in 48 hours
> Apply to partner
Per-Second Metrics at Homelab Prices

Same engine, same dashboards, same ML. Just priced for tinkerers.

Community: Free forever · 5 nodes · non-commercial
Homelab: $90/yr · unlimited nodes · fair usage
> Start monitoring your lab—free
$1,000 Per Referral. Unlimited Referrals.

Your colleagues get 10% off. You get 10% commission. Everyone wins.

10% of subscriptions, up to $1,000 each
Track earnings inside Netdata Cloud
PayPal/Venmo payouts in 3-4 weeks
No caps, no complexity
> Get your referral link
Cost Proof
40% Budget Optimization

"Netdata's significant positive impact" — LANCOM Systems

Calculate Your Savings

Compare vs Datadog, Grafana, Dynatrace

Savings Proof
46% Cost Reduction

"Cut costs by 46%, staff by 67%" — Codyas

30% Cloud Bill Savings

"Reduced cloud bill by 30%" — Falkland Islands Gov

Enterprise Proof
"Better Than Combined Alternatives"

"Better observability with Netdata than combining other tools." — TMB Barcelona

Real Engineers, <24h Response

DPA, SLAs, on-prem, volume pricing

Why Partners Win
Demo Live Infrastructure

One command, 30 seconds, real data—no sandbox needed

Zero Tickets, High Margins

Auto-config + per-node pricing = predictable profit

Homelab Ready
"Absolutely Incredible"

"We tested every monitoring system under the sun." — Benjamin Gabler, CEO Rocket.Net

76k+ GitHub Stars

3rd most starred monitoring project

Worth Recommending
Product That Delivers

Customers report 40-67% cost cuts, 99% downtime reduction

Zero Risk to Your Rep

Free tier lets them try before they buy

Never Fight Fires Alone

Docs, community, and expert help—pick your path to resolution.

Learn.netdata.cloud docs
Discord, Forums, GitHub
Premium support available
> Get answers now
60 Seconds to First Dashboard

One command to install. Zero config. 850+ integrations documented.

Linux, Windows, K8s, Docker
Auto-discovers your stack
> Read our documentation
See Netdata in Action

Watch real-time monitoring in action—demos, tutorials, and engineering deep dives.

Product demos and walkthroughs
Real infrastructure, not staged
> Start with the 3-minute tour
Level Up Your Monitoring
Real problems. Real solutions. 112+ guides from basic monitoring to AI observability.
76,000+ Engineers Strong
615+ contributors. 1.5M daily downloads. One mission: simplify observability.
Per-Second. 90% Cheaper. Data Stays Home.
Side-by-side comparisons: costs, real-time granularity, and data sovereignty for every major tool.

See why teams switch from Datadog, Prometheus, Grafana, and more.

> Browse all comparisons
Edge-Native Observability, Born Open Source
Per-second visibility, ML on every metric, and data that never leaves your infrastructure.
Founded in 2016
615+ contributors worldwide
Remote-first, engineering-driven
Open source first
> Read our story
Promises We Publish—and Prove
12 principles backed by open code, independent validation, and measurable outcomes.
Open source, peer-reviewed
Zero config, instant value
Data sovereignty by design
Aligned pricing, no surprises
> See all 12 principles
Edge-Native, AI-Ready, 100% Open
76k+ stars. Full ML, AI, and automation—GPLv3+, not premium add-ons.
76,000+ GitHub stars
GPLv3+ licensed forever
ML on every metric, included
Zero vendor lock-in
> Explore our open source
Build Real-Time Observability for the World
Remote-first team shipping per-second monitoring with ML on every metric.
Remote-first, fully distributed
Open source (76k+ stars)
Challenging technical problems
Your code on millions of systems
> See open roles
Talk to a Netdata Human in <24 Hours
Sales, partnerships, press, or professional services—real engineers, fast answers.
Discuss your observability needs
Pricing and volume discounts
Partnership opportunities
Media and press inquiries
> Book a conversation
Your Data. Your Rules.
On-prem data, cloud control plane, transparent terms.
Trust & Scale
76,000+ GitHub Stars

One of the most popular open-source monitoring projects

SOC 2 Type 2 Certified

Enterprise-grade security and compliance

Data Sovereignty

Your metrics stay on your infrastructure

Validated
University of Amsterdam

"Most energy-efficient monitoring solution" — ICSOC 2023, peer-reviewed

ADASTEC (Autonomous Driving)

"Doesn't miss alerts—mission-critical trust for safety software"

Community Stats
615+ Contributors

Global community improving monitoring for everyone

1.5M+ Downloads/Day

Trusted by teams worldwide

GPLv3+ Licensed

Free forever, fully open source agent

Why Join?
Remote-First

Work from anywhere, async-friendly culture

Impact at Scale

Your work helps millions of systems

Compliance
SOC 2 Type 2

Audited security controls

GDPR Ready

Data stays on your infrastructure

Blog

Netdata Now Troubleshoots Your Alerts for You

Netdata AI: Your Co-SRE for Alert Investigation
by Shyam Sreevalsan · August 3, 2025

The 2 AM pager alert. For anyone in Ops, SRE, or IT administration, those words trigger a familiar sense of dread. An alert has fired. Is it a real fire, or another false alarm waking you from a dead sleep? The pressure is on. Every minute of downtime costs money and reputation, but troubleshooting a complex system when you’re sleep-deprived is a Herculean task.

This cycle is a massive drain on engineering resources. The daily grind of sifting through alerts, trying to distinguish signal from noise, and manually correlating metrics to find a root cause consumes countless hours. This constant firefighting leads to alert fatigue, where even critical notifications start to get ignored. The core questions are always the same: Is this a real problem? What is the potential impact? Why did this trigger? What do I do next? Answering them is a slow, manual, and often stressful process.

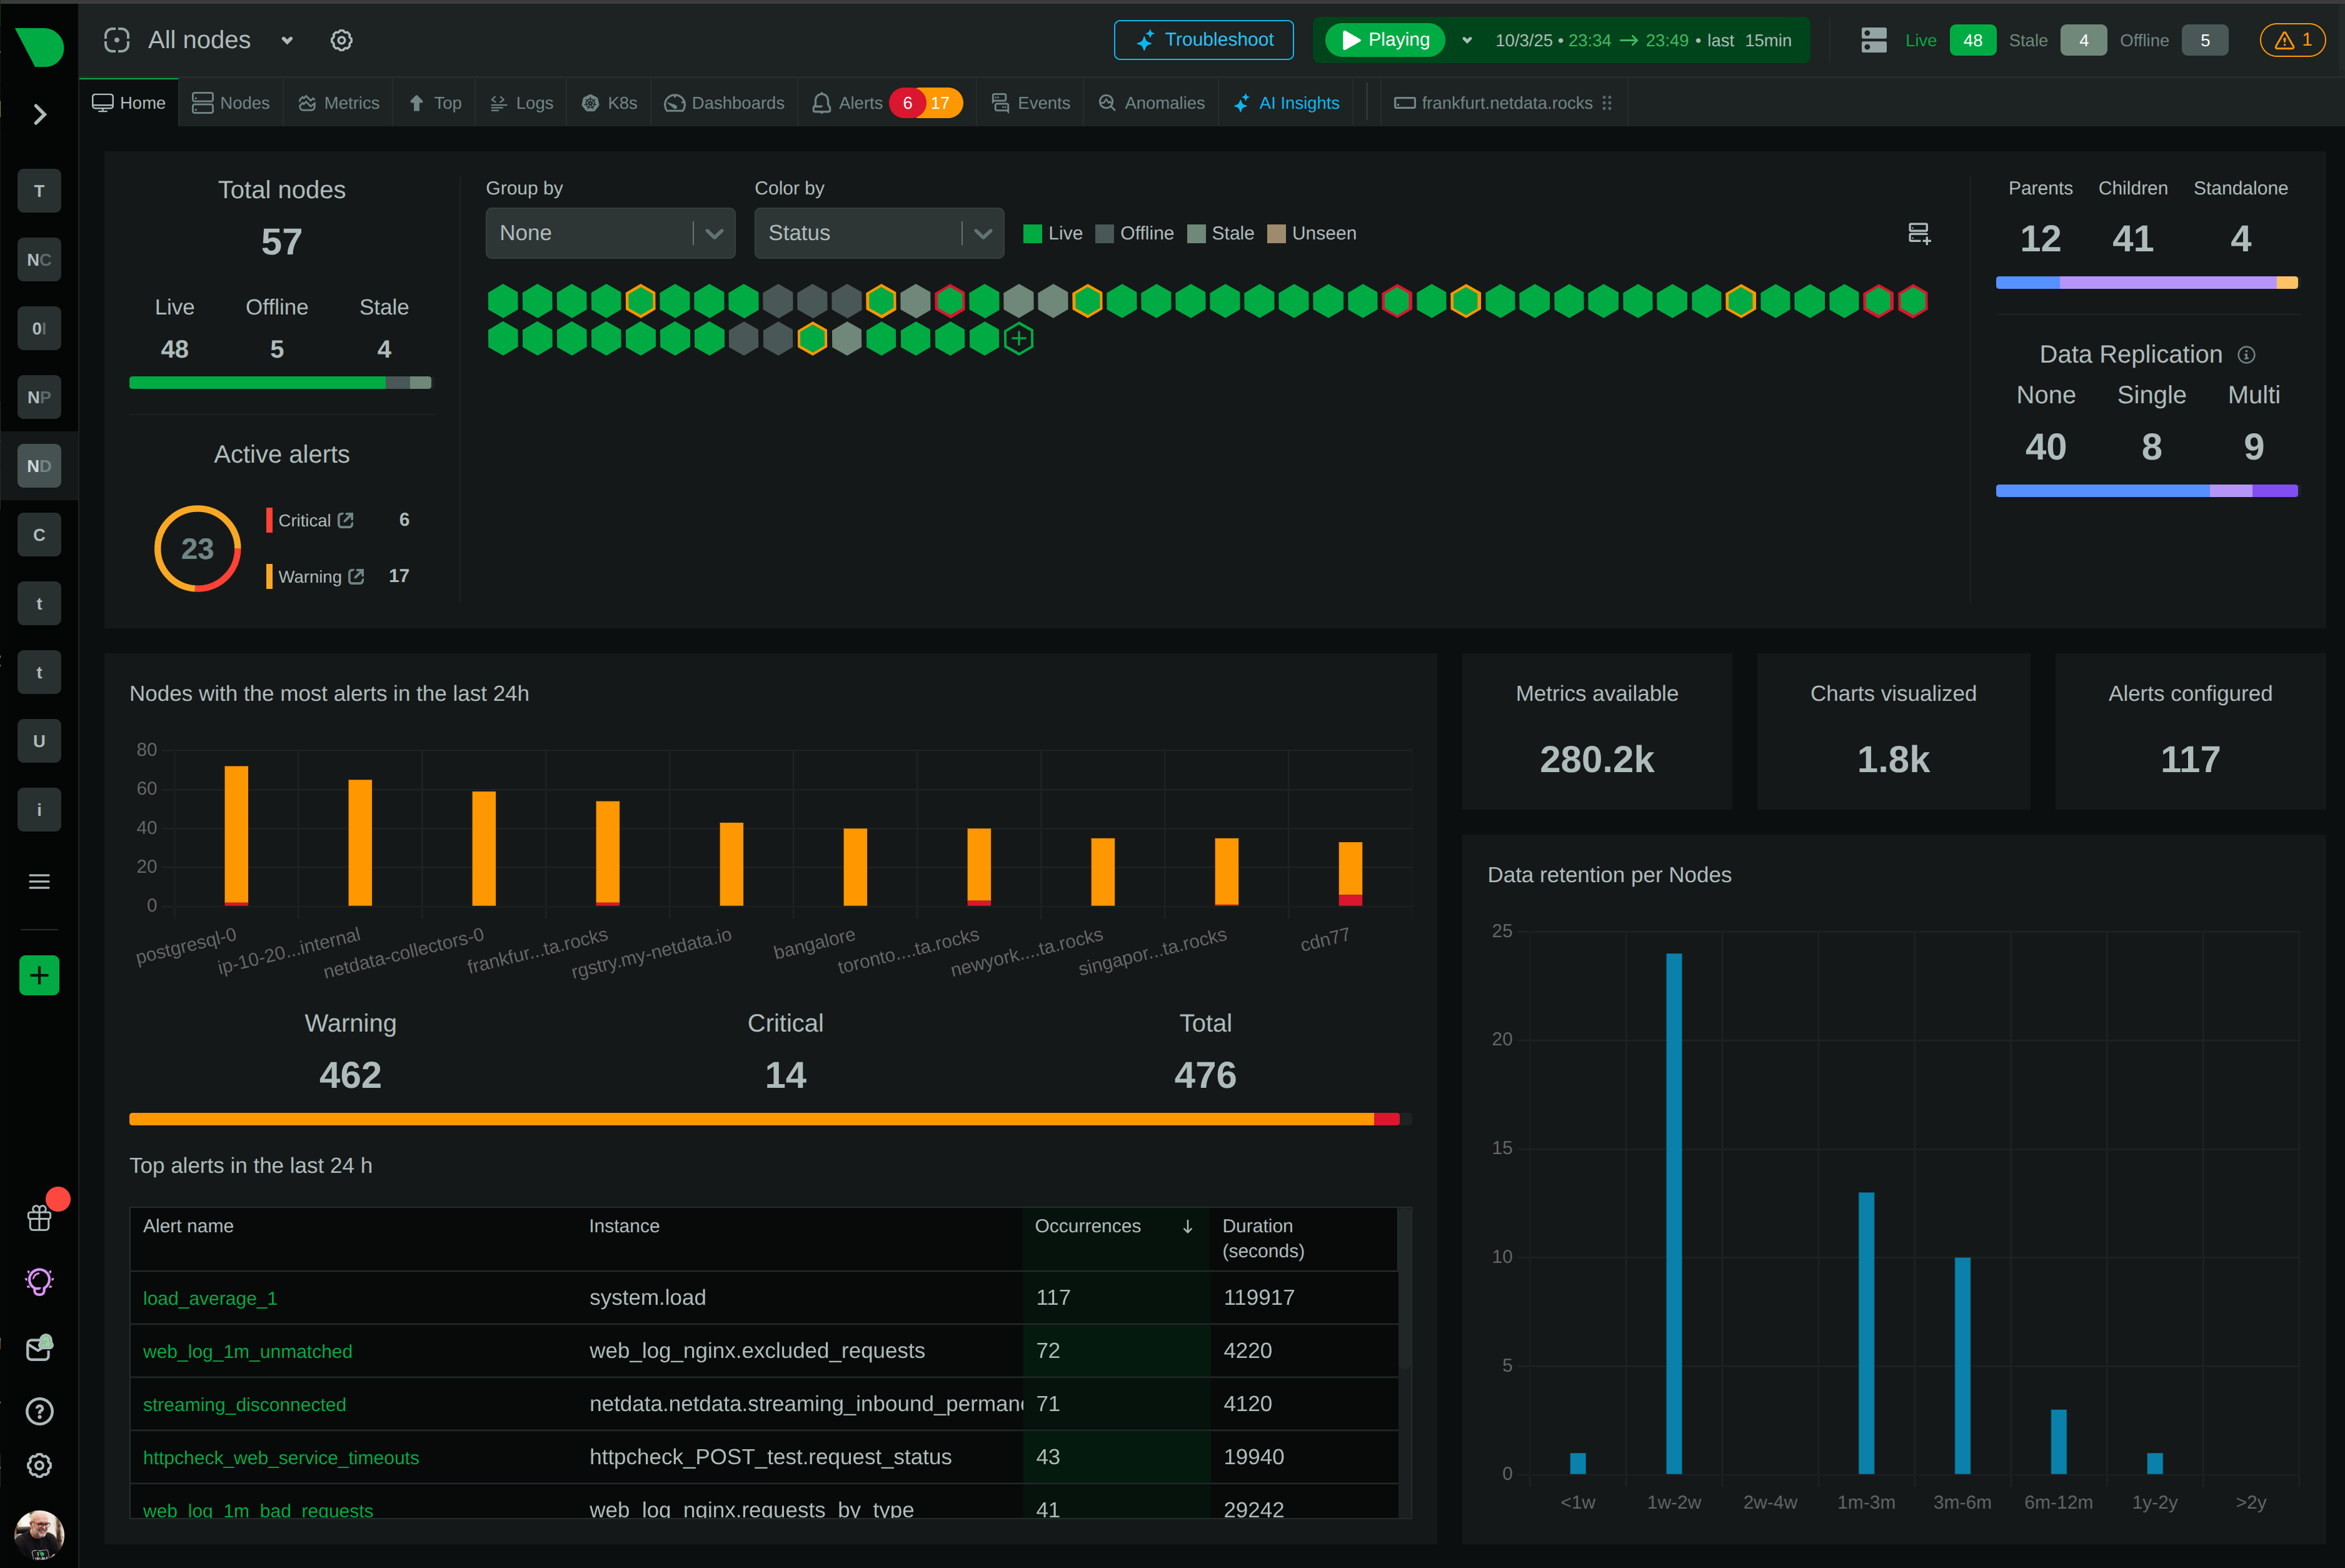
At Netdata, we’ve always focused on reducing this burden. Our platform ships with hundreds of pre-configured, zero-configuration alerts that give you immediate coverage. But we know, and have heard from so many of you that we could do more. Troubleshooting alerts, understanding what is really going on and what to do about it was still a major pain point for our users.

Until now.

Netdata AI: Your Co-SRE for Troubleshooting

We’re excited to introduce the next step in our AI journey: Automated Alert Troubleshooting.

Think of it as your new Co-SRE. Its job is to perform the initial, time-consuming investigation for you. When an alert triggers, you no longer start your analysis from zero. Instead, you begin with a comprehensive report that has already done the heavy lifting.

With the click of a button, Netdata’s AI will:

  • Analyze the Alert: It examines the alert’s history and the behavior of the underlying metrics to determine if it looks like a transient false positive or a legitimate issue.

  • Identify Correlated Factors: The AI engine scans thousands of other metrics and log patterns across your infrastructure to find what else was behaving abnormally at the same time. This helps uncover hidden dependencies and potential root causes that are incredibly difficult for a human to spot.

  • Provide a Root Cause Hypothesis: Based on its analysis, the AI provides a summary of its findings and suggests a likely root cause, pointing you directly to the metrics or dimensions that matter most.

This means you can skip the grunt work of data collection and correlation. You can jump straight to validation and resolution, armed with a powerful baseline analysis.

Putting Your Co-SRE to Work

We’ve integrated this new capability directly into your existing workflows, making it simple to access whenever you need it. You can trigger an AI troubleshooting investigation in several ways:

  1. From the Alerts Tab: When viewing your active or recent alerts, you’ll see a new “Ask AI” button next to each one. Click it, and Netdata will begin the investigation.

image

  1. From the Insights Tab: Navigate to the “Insights” tab and select “Alert Troubleshooting” from the investigations section. From there, you can choose any recent alert from the dropdown menu to begin your analysis.

image

  1. From Your Alert Notifications: When you receive an alert notification via email, you will now see an option to “Troubleshoot with AI”. Clicking this link will automatically kick off the investigation for that specific alert.

An analysis typically takes one to two minutes to complete. Once ready, the report will appear in your Alerts tab and be saved in the Insights tab under “Investigations”. You’ll also receive an email notification letting you know your report is ready for review.

image

Coming Soon: We are already working on the ability to have your Co-SRE work proactively. Soon, you will be able to schedule automatic troubleshooting for specific alerts. Any time a new alert of that type fires, an investigation will be run automatically, ensuring the analysis is waiting for you the moment you see the notification.

These capabilities are the first of many powered by Netdata AI: Your Co-SRE. To learn more about the core technology and our vision for a proactive future that goes beyond reactive troubleshooting, read our introduction to the Netdata Insights platform.

The First Step on a New Journey

This is the first iteration of our Automated Alert Troubleshooting feature. Our team is working continuously to refine the AI models, improve the quality and depth of the analysis, and expand its capabilities. You can expect to see significant enhancements and new functionality in the near future as we teach your Co-SRE to handle even more complex scenarios.

How to Get Access

Automated Alert Troubleshooting is now available in preview mode.

  • All users on a Business plan will get 10 AI troubleshooting sessions per month during their Business plan trial
  • All newly signed-up users will get 10 AI troubleshooting as part of their free trial
  • Community users who want to try the feature can request access by contacting us at [email protected]

Soon, we will also be offering credit bundles, allowing you to purchase troubleshooting sessions and other AI-powered insights on-demand, all at the cost-optimal pricing you expect from Netdata.

Stop wasting time on the initial drudgery of alert investigation. Let your Co-SRE handle the first pass and get back your most valuable resource: time to build, innovate, and solve real problems.

Try it today in Netdata Cloud →

P.S: We know that the alert customization and new alert creation experience can be a lot simpler and smoother and we are tackling this problem head on as well, but in the meantime automated troubleshooting can hopefully take the edge off your alert fatigue.