Netdata is zero-configuration monitoring. It’s a principle that we’ve stood behind since the project’s beginning, when it was only our CEO Costa trying to solve a “painful, real-world problem,” and it’s one we stand by today. Our insistence on zero-configuration guides every product decision we make, every grooming process, and every React component our frontend teams design.
In fact, zero-configuration is the exact reason why Netdata’s dashboard is open and accessible by default. It’s how Netdata gets you from 0 monitoring to thousands of metrics, collected every second and visualized in real time, in a matter of minutes.
Want proof?
We made a video so you can see zero-configuration in action. Hit play.For your technical verification, here’s what we started with:
A single AWS Lightsail instance: 4 GB RAM, 2 vCPUs, 80 GB SSD Previously installed applications: Nginx MySQL Elasticsearch Memcached Docker, with the following running containers: WordPress Ghost RabbitMQ MongoDB CockroachDB And what we ended up with:
2,945 metrics collected every second 420 real-time visualizations on both http://NODE:19999 and in Netdata Cloud 177 preconfigured alarms Metric Correlations on the single node Nginx monitoring MySQL monitoring CockroachDB monitoring Elasticsearch monitoring Memcached monitoring Docker monitoring WordPress monitoring Ghost monitoring RabbitMQ monitoring MongoDB monitoring The impact of zero-configuration on single-node and infrastructure monitoring We designed Netdata to democratize monitoring, and zero-configuration is a massive part of that story. Here’s what it means, practically speaking, for your next monitoring efforts.
Anyone can install Netdata in their infrastructure
The one-line kickstart script has simplicity in mind. The script does install Netdata from its source code, which is hosted on GitHub, but in a completely autonomous way. You don’t have to worry about adding new APT repositories and signing keys, and you don’t have to worry about compiling source code yourself. You don’t even need to worry about whether you’re supposed to use sudo or not.
The installation process is easy, and also incredibly flexible. If you want to deploy Netdata to many nodes simultaneously for infrastructure monitoring, you can extend the installer with infrastructure-as-code tools, like an Ansible playbook, and still get all the zero-configuration benefits.
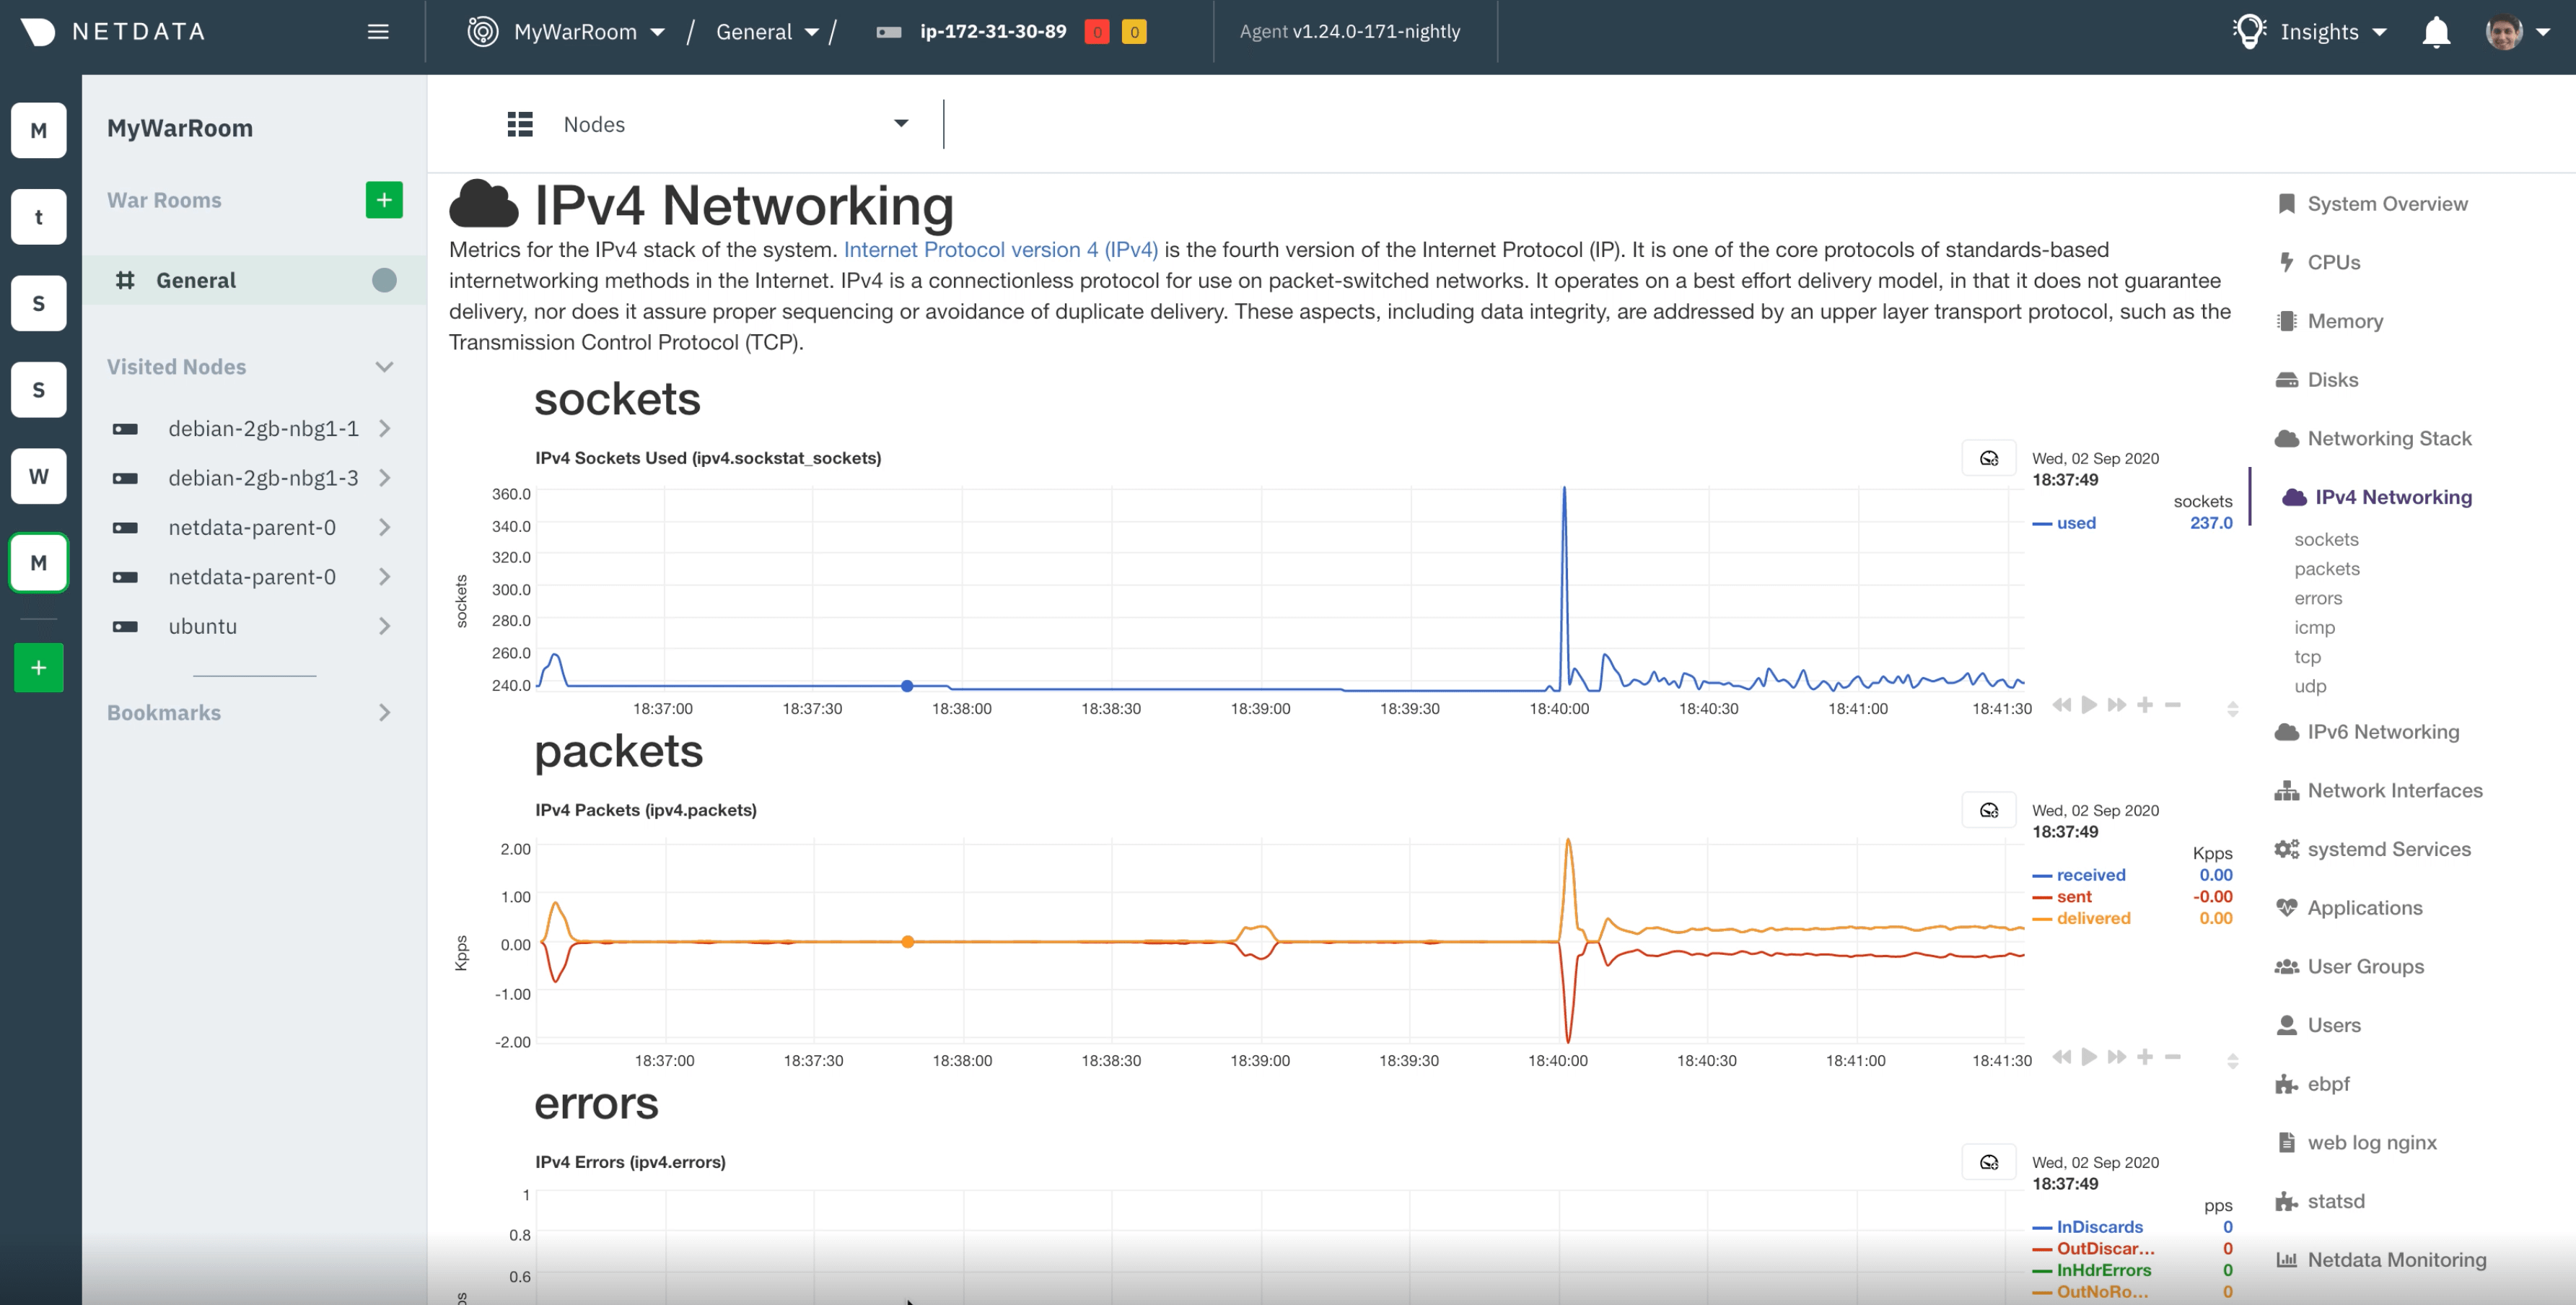
Anyone can explore visualizations With Netdata, you get hundreds of real-time visualizations out of the box. They come with all the properly labeled dimensions, units, and axes to help you immediately understand what’s going on with your system. Dashboard visualizations include all your systems’ and applications’ health metrics, including a CPU benchmark, disk usage, RAM, network traffic, uptime, system memory, and much more. Netdata presents some metrics as charts, others as gauges, for immediate results with the proper context.
All of this happens without any configuration or intervention on your part, so you can stop wasting time writing SQL queries and start troubleshooting the instant Netdata starts running on your system. And with helpful descriptions along the way, you don’t have to be a monitoring guru to start making smarter decisions about your infrastructure.
When you bring your nodes to Netdata Cloud, you can see any number of them on a single dashboard thanks to composite charts.
Anyone can monitor system/application health and performance Netdata ships with hundreds of preconfigured alarms for all types of metrics, and enables all the relevant ones upon installation. Our example node had 184 preconfigured alarms for everything from system CPU utilization to MySQL table locks over the last 10 seconds.
You can immediately see notifications for these alarms when looking at the local Agent dashboard or the Alarms panel in Netdata Cloud. If you’d like to do a bit of configuration, you can also enable one or more of dozens of supported notification endpoints. With these tools, anyone can monitor the health and performance of their infrastructure, whether it’s a single node or a hundred.
Anyone can do cloud monitoring And if you connect many nodes to Netdata Cloud, you can use the Overview dashboard, complete with composite charts, to see an entire infrastructure, regardless of whether it’s an entirely cloud based environment, hybrid cloud or multicloud, or a microservices architecture . Composite charts feature aggregated metrics from all connected nodes, and use smart defaults so you don’t have to spend any time configuring them.
From the Overview, you can drill down to single for targeted analysis with every per-second metric you need.
Anyone can use Metric Correlations for incident management and root cause analysis And once you’re viewing a single-node’s dashboard in Netdata Cloud, use Metric Correlations to figure out whether that blip in MySQL table locks is a strange hiccup or a full-blown incident. Simply click the Metrics Correlations button, select a timeframe where this potential incident is taking place, and let the system work its magic.
In a few seconds, with no configuration on your part, you get an algorithmically-focused dashboard that shows only the charts that are trending together. This narrow focus helps you not only determine the severity of a potential incident, but also discover the root cause faster, and without relying on clunky console tools.
There’s no training process involved, no cost, and no need for a data science degree from Carnegie Mellon.
What’s next? Well, that should be pretty clear. It’s time to go from 0 to monitoring yourself. Just hit the link below to get started.


