The only agent that thinks for itself

Autonomous Monitoring with self-learning AI built-in, operating independently across your entire stack.

Unlimited Metrics & Logs
Machine learning & MCP
5% CPU, 150MB RAM
3GB disk, >1 year retention
800+ integrations, zero config
Dashboards, alerts out of the box
> Discover Netdata Agents
Centralized metrics streaming and storage

Aggregate metrics from multiple agents into centralized Parent nodes for unified monitoring across your infrastructure.

Stream from unlimited agents
Long-term data retention
High availability clustering
Data replication & backup
Scalable architecture
Enterprise-grade security
> Learn about Parents
Fully managed cloud platform

Access your monitoring data from anywhere with our SaaS platform. No infrastructure to manage, automatic updates, and global availability.

Zero infrastructure management
99.9% uptime SLA
Global data centers
Automatic updates & patches
Enterprise SSO & RBAC
SOC2 & ISO certified
> Explore Netdata Cloud
Deploy Netdata Cloud in your infrastructure

Run the full Netdata Cloud platform on-premises for complete data sovereignty and compliance with your security policies.

Complete data sovereignty
Air-gapped deployment
Custom compliance controls
Private network integration
Dedicated support team
Kubernetes & Docker support
> Learn about Cloud On-Premises
Powerful, intuitive monitoring interface

Modern, responsive UI built for real-time troubleshooting with customizable dashboards and advanced visualization capabilities.

Real-time chart updates
Customizable dashboards
Dark & light themes
Advanced filtering & search
Responsive on all devices
Collaboration features
> Explore Netdata UI
Monitor on the go

Native iOS and Android apps bring full monitoring capabilities to your mobile device with real-time alerts and notifications.

iOS & Android apps
Push notifications
Touch-optimized interface
Offline data access
Biometric authentication
Widget support
> Download apps

Best energy efficiency

True real-time per-second

100% automated zero config

Centralized observability

Multi-year retention

High availability built-in

Zero maintenance

Always up-to-date

Enterprise security

Complete data control

Air-gap ready

Compliance certified

Millisecond responsiveness

Infinite zoom & pan

Works on any device

Native performance

Instant alerts

Monitor anywhere

80% Faster Incident Resolution
AI-powered troubleshooting from detection, to root cause and blast radius identification, to reporting.
True Real-Time and Simple, even at Scale
Linearly and infinitely scalable full-stack observability, that can be deployed even mid-crisis.
90% Cost Reduction, Full Fidelity
Instead of centralizing the data, Netdata distributes the code, eliminating pipelines and complexity.
Control Without Surrender
SOC 2 Type 2 certified with every metric kept on your infrastructure.
Integrations

800+ collectors and notification channels, auto-discovered and ready out of the box.

800+ data collectors
Auto-discovery & zero config
Cloud, infra, app protocols
Notifications out of the box
> Explore integrations
Real Results
46% Cost Reduction

Reduced monitoring costs by 46% while cutting staff overhead by 67%.

— Leonardo Antunez, Codyas

Zero Pipeline

No data shipping. No central storage costs. Query at the edge.

From Our Users
"Out-of-the-Box"

So many out-of-the-box features! I mostly don't have to develop anything.

— Simon Beginn, LANCOM Systems

No Query Language

Point-and-click troubleshooting. No PromQL, no LogQL, no learning curve.

Enterprise Ready
67% Less Staff, 46% Cost Cut

Enterprise efficiency without enterprise complexity—real ROI from day one.

— Leonardo Antunez, Codyas

SOC 2 Type 2 Certified

Zero data egress. Only metadata reaches the cloud. Your metrics stay on your infrastructure.

Full Coverage
800+ Collectors

Auto-discovered and configured. No manual setup required.

Any Notification Channel

Slack, PagerDuty, Teams, email, webhooks—all built-in.

Built for the People Who Get Paged
Because 3am alerts deserve instant answers, not hour-long hunts.
Every Industry Has Rules. We Master Them.
See how healthcare, finance, and government teams cut monitoring costs 90% while staying audit-ready.
Monitor Any Technology. Configure Nothing.
Install the agent. It already knows your stack.
From Our Users
"A Rare Unicorn"

Netdata gives more than you invest in it. A rare unicorn that obeys the Pareto rule.

— Eduard Porquet Mateu, TMB Barcelona

99% Downtime Reduction

Reduced website downtime by 99% and cloud bill by 30% using Netdata alerts.

— Falkland Islands Government

Real Savings
30% Cloud Cost Reduction

Optimized resource allocation based on Netdata alerts cut cloud spending by 30%.

— Falkland Islands Government

46% Cost Cut

Reduced monitoring staff by 67% while cutting operational costs by 46%.

— Codyas

Real Coverage
"Plugin for Everything"

Netdata has agent capacity or a plugin for everything, including Windows and Kubernetes.

— Eduard Porquet Mateu, TMB Barcelona

"Out-of-the-Box"

So many out-of-the-box features! I mostly don't have to develop anything.

— Simon Beginn, LANCOM Systems

Real Speed
Troubleshooting in 30 Seconds

From 2-3 minutes to 30 seconds—instant visibility into any node issue.

— Matthew Artist, Nodecraft

20% Downtime Reduction

20% less downtime and 40% budget optimization from out-of-the-box monitoring.

— Simon Beginn, LANCOM Systems

Pay per Node. Unlimited Everything Else.

One price per node. Unlimited metrics, logs, users, and retention. No per-GB surprises.

Free tier—forever
No metric limits or caps
Retention you control
Cancel anytime
> See pricing plans
What's Your Monitoring Really Costing You?

Most teams overpay by 40-60%. Let's find out why.

Expose hidden metric charges
Calculate tool consolidation
Customers report 30-67% savings
Results in under 60 seconds
> See what you're really paying
Your Infrastructure Is Unique. Let's Talk.

Because monitoring 10 nodes is different from monitoring 10,000.

On-prem & air-gapped deployment
Volume pricing & agreements
Architecture review for your scale
Compliance & security support
> Start a conversation
Monitoring That Sells Itself

Deploy in minutes. Impress clients in hours. Earn recurring revenue for years.

30-second live demos close deals
Zero config = zero support burden
Competitive margins & deal protection
Response in 48 hours
> Apply to partner
Per-Second Metrics at Homelab Prices

Same engine, same dashboards, same ML. Just priced for tinkerers.

Community: Free forever · 5 nodes · non-commercial
Homelab: $90/yr · unlimited nodes · fair usage
> Start monitoring your lab—free
$1,000 Per Referral. Unlimited Referrals.

Your colleagues get 10% off. You get 10% commission. Everyone wins.

10% of subscriptions, up to $1,000 each
Track earnings inside Netdata Cloud
PayPal/Venmo payouts in 3-4 weeks
No caps, no complexity
> Get your referral link
Cost Proof
40% Budget Optimization

"Netdata's significant positive impact" — LANCOM Systems

Calculate Your Savings

Compare vs Datadog, Grafana, Dynatrace

Savings Proof
46% Cost Reduction

"Cut costs by 46%, staff by 67%" — Codyas

30% Cloud Bill Savings

"Reduced cloud bill by 30%" — Falkland Islands Gov

Enterprise Proof
"Better Than Combined Alternatives"

"Better observability with Netdata than combining other tools." — TMB Barcelona

Real Engineers, <24h Response

DPA, SLAs, on-prem, volume pricing

Why Partners Win
Demo Live Infrastructure

One command, 30 seconds, real data—no sandbox needed

Zero Tickets, High Margins

Auto-config + per-node pricing = predictable profit

Homelab Ready
"Absolutely Incredible"

"We tested every monitoring system under the sun." — Benjamin Gabler, CEO Rocket.Net

76k+ GitHub Stars

3rd most starred monitoring project

Worth Recommending
Product That Delivers

Customers report 40-67% cost cuts, 99% downtime reduction

Zero Risk to Your Rep

Free tier lets them try before they buy

Never Fight Fires Alone

Docs, community, and expert help—pick your path to resolution.

Learn.netdata.cloud docs
Discord, Forums, GitHub
Premium support available
> Get answers now
60 Seconds to First Dashboard

One command to install. Zero config. 850+ integrations documented.

Linux, Windows, K8s, Docker
Auto-discovers your stack
> Read our documentation
See Netdata in Action

Watch real-time monitoring in action—demos, tutorials, and engineering deep dives.

Product demos and walkthroughs
Real infrastructure, not staged
> Start with the 3-minute tour
Level Up Your Monitoring
Real problems. Real solutions. 112+ guides from basic monitoring to AI observability.
76,000+ Engineers Strong
615+ contributors. 1.5M daily downloads. One mission: simplify observability.
Per-Second. 90% Cheaper. Data Stays Home.
Side-by-side comparisons: costs, real-time granularity, and data sovereignty for every major tool.

See why teams switch from Datadog, Prometheus, Grafana, and more.

> Browse all comparisons
Edge-Native Observability, Born Open Source
Per-second visibility, ML on every metric, and data that never leaves your infrastructure.
Founded in 2016
615+ contributors worldwide
Remote-first, engineering-driven
Open source first
> Read our story
Promises We Publish—and Prove
12 principles backed by open code, independent validation, and measurable outcomes.
Open source, peer-reviewed
Zero config, instant value
Data sovereignty by design
Aligned pricing, no surprises
> See all 12 principles
Edge-Native, AI-Ready, 100% Open
76k+ stars. Full ML, AI, and automation—GPLv3+, not premium add-ons.
76,000+ GitHub stars
GPLv3+ licensed forever
ML on every metric, included
Zero vendor lock-in
> Explore our open source
Build Real-Time Observability for the World
Remote-first team shipping per-second monitoring with ML on every metric.
Remote-first, fully distributed
Open source (76k+ stars)
Challenging technical problems
Your code on millions of systems
> See open roles
Talk to a Netdata Human in <24 Hours
Sales, partnerships, press, or professional services—real engineers, fast answers.
Discuss your observability needs
Pricing and volume discounts
Partnership opportunities
Media and press inquiries
> Book a conversation
Your Data. Your Rules.
On-prem data, cloud control plane, transparent terms.
Trust & Scale
76,000+ GitHub Stars

One of the most popular open-source monitoring projects

SOC 2 Type 2 Certified

Enterprise-grade security and compliance

Data Sovereignty

Your metrics stay on your infrastructure

Validated
University of Amsterdam

"Most energy-efficient monitoring solution" — ICSOC 2023, peer-reviewed

ADASTEC (Autonomous Driving)

"Doesn't miss alerts—mission-critical trust for safety software"

Community Stats
615+ Contributors

Global community improving monitoring for everyone

1.5M+ Downloads/Day

Trusted by teams worldwide

GPLv3+ Licensed

Free forever, fully open source agent

Why Join?
Remote-First

Work from anywhere, async-friendly culture

Impact at Scale

Your work helps millions of systems

Compliance
SOC 2 Type 2

Audited security controls

GDPR Ready

Data stays on your infrastructure

Blog

Kubernetes Throttling Doesn’t Have To Suck. Let Us Help!

Addressing Performance Hiccups in Kubernetes Deployments
by Costa Tsaousis · May 3, 2022

CPU limits are probably the most misunderstood concept in Kubernetes CPU resources allocation and management.

A lot of engineers advise the use of CPU limits on every container as Kubernetes best practice. Unfortunately, as we will prove below, they are wrong: CPU limits should rarely be used, if used at all!

But why? What are the reasons that even senior DevOps engineers with vast experience in the field advise the use of CPU limits?

By discussing this subject with DevOps engineers, I understood that they use CPU limits for one or more of the following reasons:

“To ensure cluster stability.”

They are afraid that without CPU limits, crucial Kubernetes components will be starved of CPU resources and eventually the cluster will become unreliable and unstable. This is a myth! K8s components will always get their fair share of CPU resources, no matter how much load we put on the cluster. In fact, K8s configures CPU shares in such a way that it is impossible for its crucial components to be starved of CPU.

“To ensure fair distribution of CPU resources among different hosted services.”

Engineers believe that without set CPU limits, a service may monopolize the available CPU resources and eventually impair the performance of other services running on the cluster.

This is also a myth. CPU requests define the relative CPU weights on which CPU resources will be allocated. CPU requests, not CPU limits.

During my interaction with DevOps engineers, I finally realized that there is another reason, never openly admitted, but there nevertheless:

“Rather be safe than sorry!”

When engineers deal with an “important matter" such as a production k8s cluster, they’d rather err on the safe side, and assume CPU limits will isolate potential bad actors from other services running on the cluster.

It seems logical, but the real benefits from such a strategy are so minimal—and its consequences so dramatic—that there is really no value in this strategy.

Why are CPU limits bad?

CPU limits set a cap, or ceiling, on the CPU resources a container can use—for example, you might limit a container to use up to 1 CPU core.

And here come the problems:

“It uses just half a core, so the limits are fine.”

Wrong! Depending on the type of load, the application may be severely throttled. Why? Most modern applications are multi-threaded. A web server spawns several workers to service incoming requests, with these workers running in parallel on multi-core hardware. If 10 workers want to use 100ms each, they will exhaust the 1 core limit in just 100ms, so their average CPU utilization over a period of 10 or 15 seconds will not even be close to 50%.

To hide the problem even deeper, engineers frequently use the average CPU utilization of multiple containers to make such judgements.

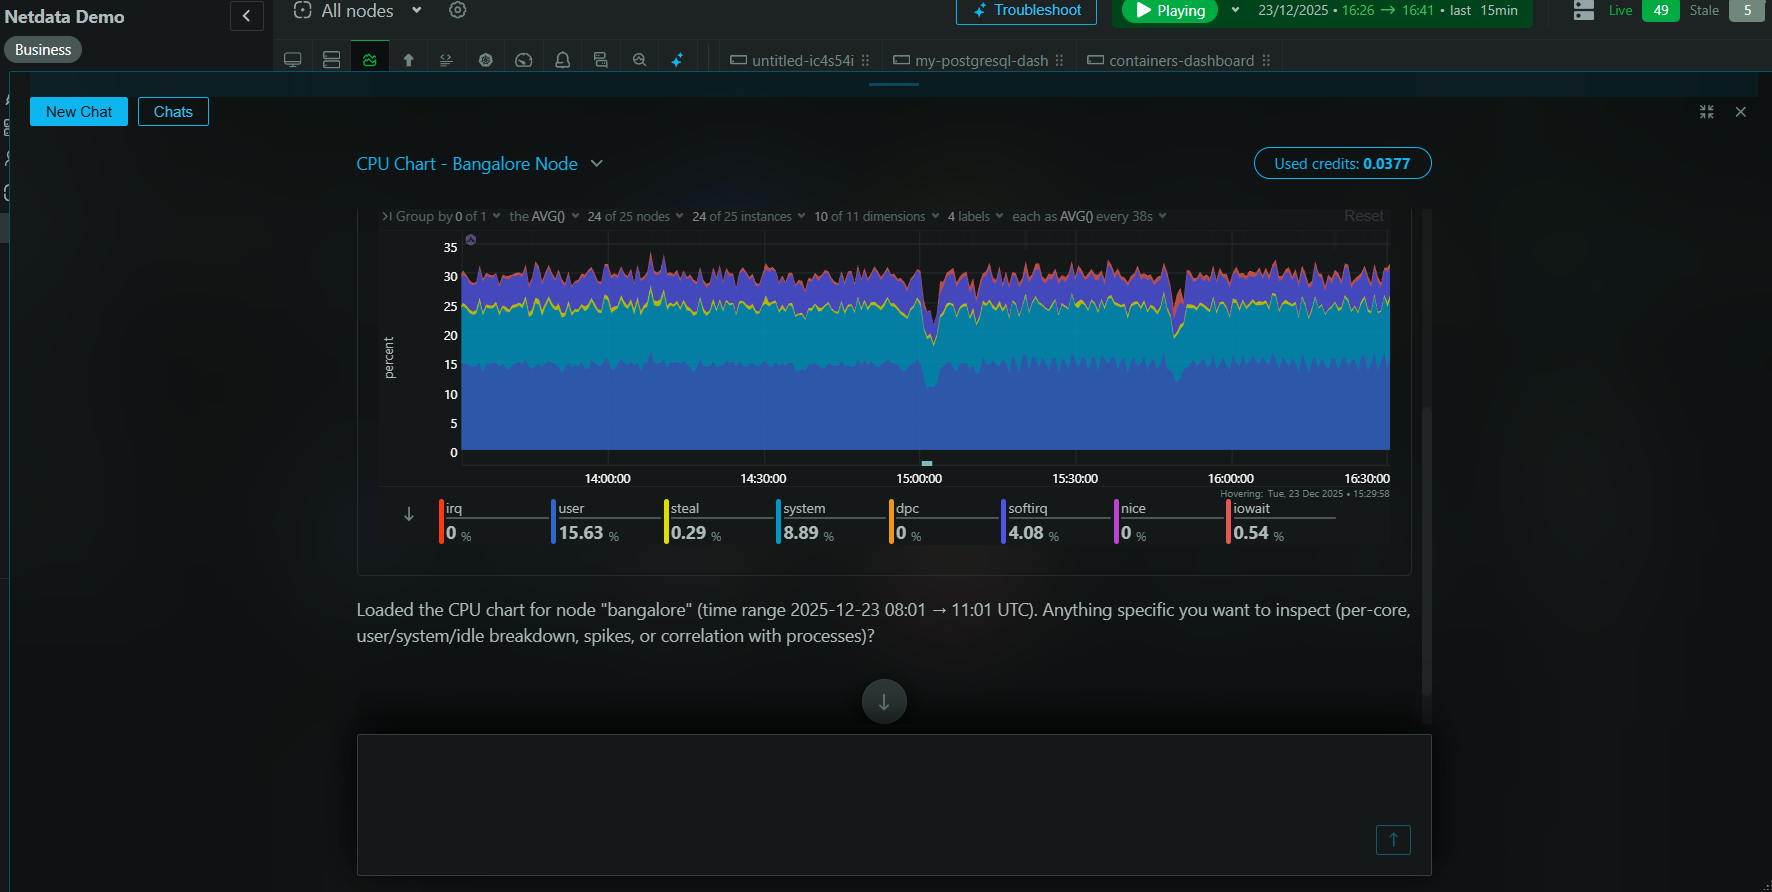
Using high fidelity monitoring like Netdata’s, with a 1-second interval, we observed that a web server container can be throttled by up to 50% while its average 1-second CPU utilization is below 80%. On busy web server containers, throttling kicks in at about 60% of average 1-second CPU utilization.

“The hunt for the slow response.”

This is probably the biggest time-waster ever. All kinds of wrong conclusions play a role: “The DB couldn’t do it," “This request handling is badly written," “The slow request had something special to do," and many more. All wrong.

We have been here ourselves, and what did we discover, after spending weeks hunting slow responses? By simply removing CPU limits from containers, we managed to reduce response times . . . by a factor of 7.

Severely underutilized clusters

This is the biggest waste of money yet: CPU requests cannot be overbooked. If you have 24 cores, you can distribute 24 cores to containers. Period. But when people set limits, they usually set them equal to the requests or at most double. It is very rare to see a limit 10 times bigger than the request. This has the effect that the only way for the cluster to get more capacity is to scale out, to add another node to the cluster. The result of this is that the cluster gets a lot of nodes with 5%, 10%, or 15% of total CPU utilization.

Modern multi-core hardware and Linux kernels can perfectly utilize all the available resources. Of course, we shouldn’t be running our clusters at 100%: response latency will suffer at that level. But it is reasonable to expect at least 50% of total CPU utilization of all nodes in the cluster before a new node is required. Anything below the 50% threshold and you’re probably wasting your money.

The only way to know for sure that your containers are not throttled is to use a tool like Netdata that collects and visualizes CPU throttling metrics directly from CGROUPS. There is really no other way to safely conclude that your services are not being throttled when using CPU limits.

We did our own lab test to see how throttling works. Check it out in the video starting at 11:03!

Cluster stability

K8s nodes ensure their crucial services will always get the CPU resources they need. This is done with CGROUPS CPU shares, like this:

At the cpu controller of CGROUPS, we can see that there are 3 top level CGROUPS:

  1. system.slice, with a CPU Share of 1024 (100% of a single core)
  2. user.slice, with a CPU Share of 1024 (100% of a single core)
  3. kubepods, with a CPU Share equal to the number of cores in the node, times about 1000, so for a 4-core node this will be about 4000
CPU shares are arbitrary numbers that define relative weight between CGROUPS. This actually means that on our 4-core node example, although K8s says to us that we can allocate 4000 millicpu, behind the scenes it has actually allocated two-thirds of that, because the rest is allocated to its own services. CPU limits do not play any role in this. With or without limits on our containers, the crucial K8s services will still run.

At 24:06 in the video, we show in detail how K8s manages to remain stable under extreme CPU loads.

Fair distribution of CPU resources on hosted services

All our containers run inside the kubepods top level CGROUP hierarchy. As we show in the video, all our containers are grouped in 3 categories:

  1. Guaranteed containers — with CPU Shares defined as whatever we set as requests and limits (requests and limits have to be equal for a container to be guaranteed)
  2. Burstable containers — with CPU Shares defined as whatever we set as requests.
  3. Best effort containers — all of them together allocated 2 CPU Shares (0.002% of a single core).
The relative weight of CPU allocation is only controlled by the CPU Shares. 

In the video, we show that k8s actually does an amazing job of respecting the relative weights of containers. By just setting CPU requests, each container gets its fair share of CPU resources.

Final words

  • CPU limits are really confusing: they may influence your applications’ response latency significantly and it's hard to predict when they might kick in. Unless you have a very good reason to use them, don’t.
  • CPU requests alone are perfectly adequate for defining CPU weights among containers, and the Linux kernel does an amazing job of allocating them to containers.
  • The K8s cluster stability is not threatened by the absence of CPU limits. The crucial K8s services will still run as they should.
  • CPU limits will not protect against increased latency. Under extreme loads, latency will increase. The only way to avoid this is to configure the K8s cluster to add more nodes, providing more compute capacity to the cluster.
Can CPU limits ever be appropriate? Well, OK, they may still help in special cases, like when some buggy software is wasting CPU resources, or on batch jobs where responsiveness and latency are less important. In such cases, CPU limits may help reduce load peaks and may reduce the likelihood of more latency-sensitive containers bursting.

Still doubtful about removing CPU limits from your Kubernetes clusters? I suggest you increase them significantly and install Netdata to monitor them to ensure important applications are not being throttled. (And hopefully our solutions and demonstrations will help you dramatically reduce the cost of monitoring and maintaining your infrastructure.)

Look out for more news about our K8s monitoring capability—in the meantime, find out more on our website and our knowledge docs. Thoughts, questions or suggestions? Share them on our Discord server or community forum!

Note from May 10, 2022: This article is an updated version of an article published on May 2, 2022.