When it comes to monitoring system performance on Linux, the load average is one of the most referenced metrics. Displayed prominently in tools like top, uptime, and htop, it’s often used as a quick gauge of system load and capacity. But how reliable is it? For complex, multi-threaded applications, load average can paint a misleading picture of actual system performance.
In this article, we’ll dive into the myths and realities of Linux load average, using insights from Netdata’s high-frequency, high-concurrency monitoring setup. Through this journey, we’ll uncover why load average spikes can occur even under steady workloads, and why a single metric is rarely enough to capture the true state of a system. Whether you’re a system administrator, developer, or performance enthusiast, this exploration of load average will help you interpret it more accurately and understand when it may—or may not—reflect reality.
The Reality
In this example, we have a Netdata Parent receiving metrics in real-time from 500 children, at a rate of about 3 million metric samples per second. This server is fully loaded, running machine learning-based anomaly detection, health checks for alerts, maintaining years of historical data retention and propagating all data to a sibling Netdata Parent (they are clustered).
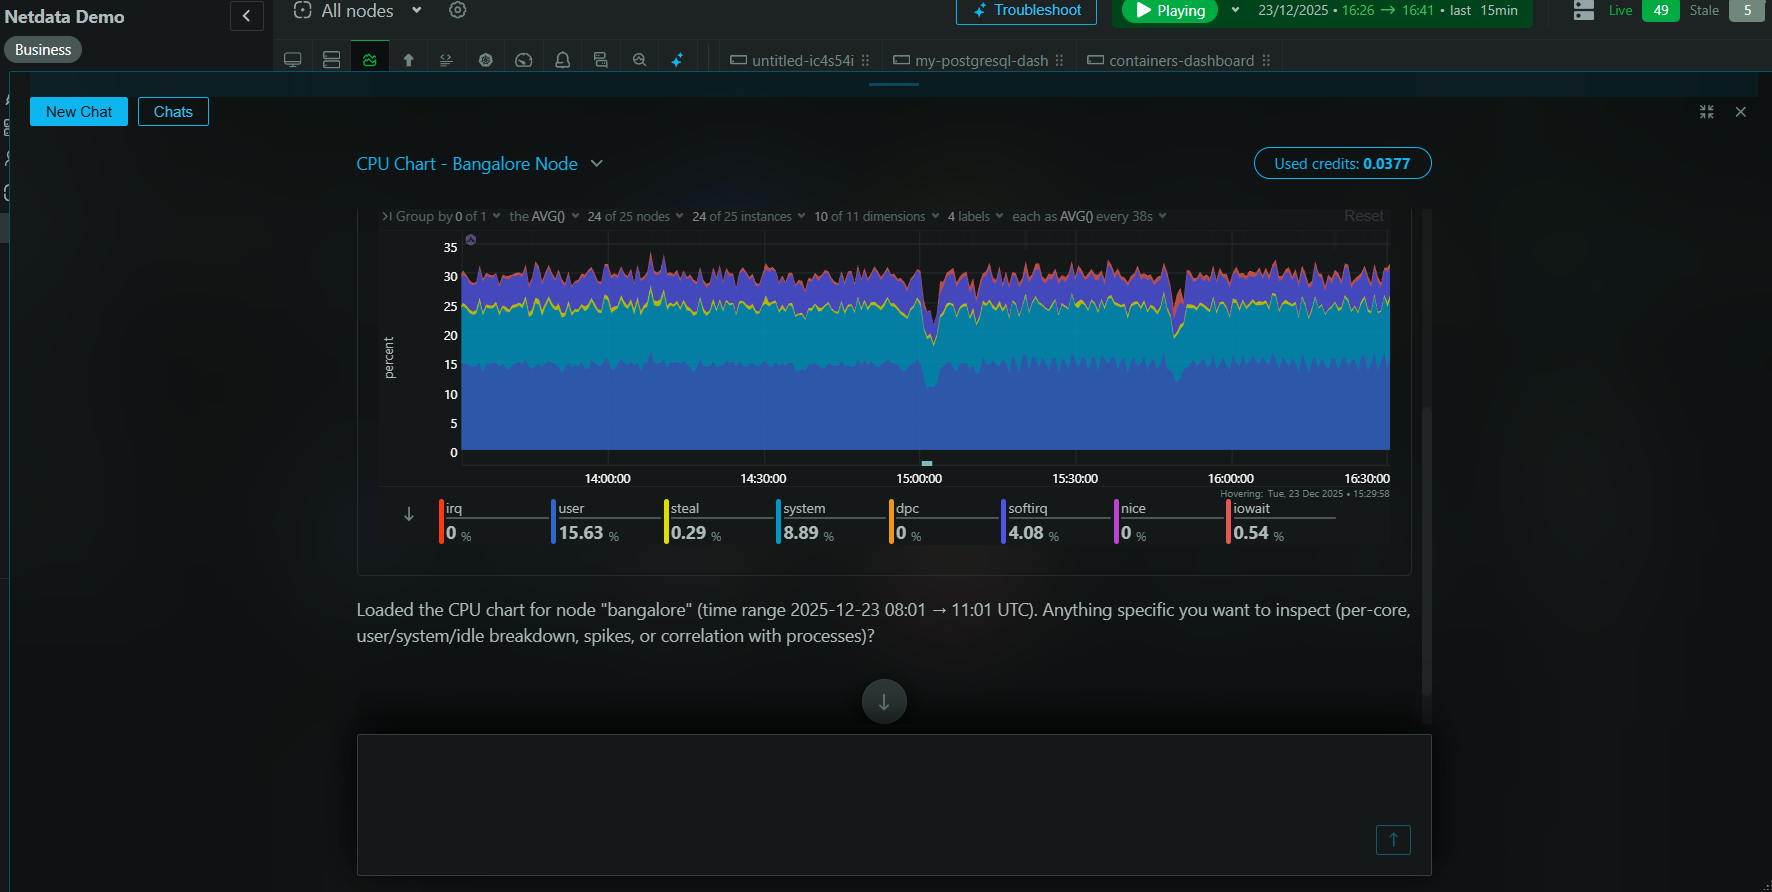
Here’s what the CPU utilization looks like: around 60% of the 24 CPU cores are consistently engaged in ingesting samples, training machine learning models, detecting anomalies, and triggering alerts.
CPU pressure information further supports this stability. The server consistently experiences around 50% CPU pressure, as shown in these charts:
However, load average tells a completely different story:
According to load average, this server experiences periodic load swings, ranging from 3.0 to 300, with a cycle of about 21 minutes. Both extremes are misleading: the server is handling far more load than 3.0, and nowhere near the extreme 300 reported at the peaks. What’s more, the 21-minute periodicity is entirely artificial—no significant event or workload in Netdata is occurring at this interval.
Why is Load Average So Misleading?
To understand why load average is so off base, let’s look at how Linux calculates this metric.
How Load Average is Calculated
Load average is essentially an exponentially weighted moving average (EWMA) of the number of runnable and uninterruptible tasks in the system. Every LOAD_FREQ interval (approximately every 5 seconds plus one tick), the kernel samples the system state, measuring active tasks and applying a decay factor to smooth out fluctuations. The result is averaged across 1, 5, and 15 minutes, giving a general sense of short-, medium-, and long-term system load.
However, to avoid excessive overhead on multi-core systems, especially those with a high number of CPUs, the kernel doesn’t simply sum up runnable tasks across all CPUs in one go. Instead, it uses an asynchronous, distributed approach to approximate the load average. This approach is efficient but introduces some inaccuracies—especially in systems with a large number of short-lived, high-frequency tasks spread across many cores.
The key is this section from the Linux kernel’s load average calculation code:
/*
 * Global load-average calculations
 *
 * We take a distributed and async approach to calculating the global load-avg
 * in order to minimize overhead.
 *
 * The global load average is an exponentially decaying average of nr_running +
 * nr_uninterruptible.
 *
 * Once every LOAD_FREQ:
 *
 *   nr_active = 0;
 *   for_each_possible_cpu(cpu)
 *	nr_active += cpu_of(cpu)->nr_running + cpu_of(cpu)->nr_uninterruptible;
 *
 *   avenrun[n] = avenrun[0] * exp_n + nr_active * (1 - exp_n)
 *
 * Due to a number of reasons the above turns in the mess below:
 *
 *  - for_each_possible_cpu() is prohibitively expensive on machines with
 *    serious number of CPUs, therefore we need to take a distributed approach
 *    to calculating nr_active.
 *
 *    ...
 *
 *  - cpu_rq()->nr_uninterruptible isn't accurately tracked per-CPU because
 *    this would add another cross-CPU cache-line miss and atomic operation
 *    to the wakeup path. Instead we increment on whatever CPU the task ran
 *    when it went into uninterruptible state and decrement on whatever CPU
 *    did the wakeup.
 */
The Distributed Approach and Its Problems in High-Concurrency Workloads
The kernel’s load calculation avoids locking all CPU cores and instead aggregates load data in a distributed manner over a short period of time, using a technique known as “folding.” Here’s what this means and why it’s problematic in high-concurrency environments:
Asynchronous Sampling: Each CPU independently records the number of runnable and uninterruptible tasks over a small interval. These per-CPU counts are then aggregated into a global load estimate, but this aggregation isn’t instantaneous. Instead, it relies on asynchronous updates to minimize locking and reduce performance overhead.
Inaccuracies in High-Frequency, High-Thread-Count Workloads: In systems like Netdata, where there are many short-lived threads that wake up and run every second, this asynchronous aggregation method can produce inaccurate load averages. Because the kernel isn’t sampling all CPUs at the exact same moment, it may double-count some tasks or miss others entirely, depending on the timing of thread execution and CPU task switching.
Artificial Peaks Due to Distributed Calculation: This approach works reasonably well for traditional workloads where tasks have a steady, constant pattern. However, in cases like Netdata—where threads are distributed across many cores with slight time offsets—the load average calculation can be highly volatile. Even with jitter applied to randomize the execution of the threads, the load average calculation can still synchronize periodically with the kernel’s aggregation, creating artificial spikes.
Why 21 minutes (or a multiple of that)?
One of our users tried to understand why the frequency is specifically around 21 minutes. In this Netdata GitHub issue, he explained that the kernel calculates load average every 5.004 seconds (5 seconds + 1 tick). He found that every 1251 seconds, the kernel’s load sampling aligns with Netdata’s thread execution, creating these periodic spikes.
Since then, we’ve added random offsets to Netdata’s threads so that each one runs at a slightly different time within each second. This lowered the load average spikes, but since each thread still needs to run in the first 400ms of each second, they’re still close enough in time to periodically synchronize with the kernel’s aggregation window.
Interestingly, load average spikes are sometimes reported at multiples of 21 minutes, such as 80–90 minutes.
Other Monitoring Tools and Load Average Workarounds
Artificial load average spikes are common for monitoring tools with high-concurrency architectures. Telegraf, for instance, implemented jitter of up to 3 seconds to spread data collection across a wider time frame. While this reduced load average spikes, it introduced noise, which can lower data accuracy.
For Netdata, we have desynchronized the threads (running at a different offset each), switched to sequential execution for certain plugins (like proc.plugin), and experimented with applying jitter of up to 100 ms to all data collection jobs. However, due to the frequency of our data collection (per second), these adjustments had limited effect on load average calculation.
Conclusion: The Limits of Load Average for High-Concurrency Workloads
The asynchronous, distributed approach to load calculation in the Linux kernel, while efficient, presents limitations in environments with a high volume of short-lived, high-frequency tasks. For applications like Netdata’s, where real-time monitoring requires frequent sampling and high concurrency, load average can produce misleading results. Artificial spikes and periodic fluctuations often stem from the kernel’s aggregation method, which struggles to keep pace with the dynamic nature of such workloads.
Another issue with load average on Linux is that, unlike most operating systems where load average is strictly about CPU utilization, Linux load average also includes tasks waiting on I/O. As Brendan Gregg explains, this adds another layer of complexity to interpreting load average accurately.
Unfortunately, there’s not much we can do to fully eliminate artificial load average spikes when running Netdata. Lowering data collection frequency and adding significant jitter would reduce spikes, but at the cost of data accuracy, which is something we prioritize at Netdata. The load average calculation in the Linux kernel simply doesn’t provide an accurate view for high-frequency, high-concurrency workloads like ours.
For users of monitoring systems, this highlights the importance of not relying solely on load average as an indicator of system health. Complementary metrics, such as CPU utilization and pressure metrics, provide a more accurate and stable view of actual resource usage and contention.
Beyond Load Average: Consider PSI for Accurate Resource Contention
For users looking for a more precise indicator of system health, Pressure Stall Information (PSI) offers a modern alternative to load average. Unlike load average, which is an aggregate view that can be skewed by high concurrency and short-lived tasks, PSI measures the pressure on specific resources (CPU, memory, and I/O) and provides insight into how often tasks are delayed due to resource contention.
PSI was introduced in the Linux kernel starting with version 4.20 and is designed to help you understand how much time tasks spend waiting for resources. Here’s a breakdown of each PSI metric and what it tells you:
CPU Pressure
system.cpu_some_pressure: This metric shows the percentage of time some tasks were delayed due to insufficient CPU resources. It indicates partial CPU contention, where some tasks experience delays but not the entire system.system.cpu_some_pressure_stall_time: This metric shows the amount of time some tasks were delayed due to insufficient CPU resources.
For containers, Netdata provides:
cgroup.cpu_some_pressure: The percentage of time some container tasks were delayed due to insufficient CPU resources.cgroup.cpu_some_pressure_stall_time: The amount of time some container tasks were delayed due to insufficient CPU resources.cgroup.cpu_full_pressure: The percentage of time all non-idle container tasks were delayed due to insufficient CPU resources.cgroup.cpu_full_pressure_stall_time: The amount of time all non-idle container tasks were delayed due to insufficient CPU resources.
Memory and I/O Pressure
Netdata provides similar pressure metrics for memory and I/O.
Why PSI is Better Than Load Average for Monitoring Contention
Unlike load average, which is an indirect measure that can be affected by task scheduling quirks and asynchronous load calculations, PSI directly measures contention on critical resources. PSI allows you to pinpoint whether the system is facing real pressure on CPU, memory, or I/O resources.
For example, if you see high system.cpu_some_pressure values, you know that some tasks are facing CPU contention. By contrast, load average can be misleading in these situations, often suggesting extreme load spikes that don’t align with actual resource contention.


