As systems increasingly shift towards distributed architectures to deliver application services, the roles of monitoring and observability have never been more crucial. Monitoring delivers the situational awareness you need to detect issues, while observability goes a step further, offering the analytical depth to understand the root cause of those issues.
Understanding the nuanced differences between monitoring and observability is crucial for anyone responsible for system health and performance. In dissecting these methodologies, we’ll explore their unique strengths, dive into practical applications, and illuminate how to strategically employ each to enhance operational outcomes.
To set the stage, consider a real-world scenario that many of us have encountered: It’s 3 a.m., and you get an alert that a critical service is down. Traditional monitoring tools may tell you what’s wrong, but they won’t necessarily tell you why it’s happening leaving that part up to you. With observability, the tool enables you to explore your system’s internal state and uncover the root cause in a faster and easier manner.
Understanding The Conceptual Framework
Monitoring has its roots in the early days of computing, dating back to mainframes and the first networked systems. The primary objective was straightforward: keep the system up and running. Threshold-based alerts and basic metrics like CPU usage, memory consumption, and disk I/O were the mainstay. These metrics provided a snapshot but often lacked the context needed for debugging complex issues.
Observability, on the other hand, is a relatively new paradigm, inspired by control theory and complex systems theory. It came to prominence with the rise of microservices, container orchestration, and cloud-native technologies. Unlike monitoring, which focuses on known problems, observability is designed to help you understand unknown issues. The concept gained traction as systems became too complex to understand merely through predefined metrics or logs.
Monitoring: The Watchtower
Monitoring is about gathering data to answer known questions. These questions usually take the form of metrics, alerts, and logs configured ahead of time. In essence, monitoring systems act as a watchtower, constantly scanning for pre-defined conditions and alerting you when something goes awry. The approach is inherently reactive; you set up alerts based on what you think will go wrong and wait.
For instance, you might set an alert for when CPU usage exceeds 90% for a prolonged period. While this gives you valuable information, it doesn’t offer insights into why this event is occurring. Was there a sudden spike in user traffic, or is there an inefficient code loop causing the CPU to max out?
Observability: The Explorer
Observability is a more dynamic concept, focusing on the ability to ask arbitrary questions about your system, especially questions you didn’t know you needed to ask. Think of observability as an explorer equipped with a map, compass, and tools that allow you to discover and navigate unknown territories of your system. With observability, you can dig deeper into high-cardinality data, enabling you to explore the “why” behind the issues.
For example, you may notice that latency has increased for a particular service. Observability tools will allow you to drill down into granular data, like traces or event logs, to identify the root cause, whether it be an inefficient database query, network issues, or something else entirely.
Monitoring Vs Observability: Key Differences Explained
Data
Monitoring and observability rely heavily on these three fundamental data types: metrics, logs and traces. However the approach taken in collecting, examining and utilizing this data can differ significantly.
Both monitoring and observability rely on data, but the kinds of data they use and how they use it can differ substantially.
Metrics in Monitoring vs Observability
Metrics serve as the backbone of both monitoring and observability, providing numerical data that is collected over time. However, the granularity, flexibility, and usage of these metrics differ substantially between the two paradigms.
Monitoring: Predefined and Aggregate Metrics
In a monitoring setup, metrics are often predefined and tend to be aggregate values, such as averages or sums calculated over a specific time window. These metrics are designed to trigger alerts based on known thresholds. For example, you might track the average CPU usage over a five-minute window and set an alert if it exceeds 90%. While this approach is effective for catching known issues, it lacks the context needed to understand why a problem is occurring.
Observability: High-Fidelity, High-Granularity and Context-Rich Metrics
Observability platforms go beyond merely collecting metrics; they focus on high-granularity, real-time metrics that can be dissected and queried in various ways. Here, you’re not limited to predefined aggregate values. You can explore metrics like request latency at the 99th percentile over a one-second interval or look at the distribution of database query times for a particular set of conditions. This depth allows for a more nuanced understanding of system behavior, enabling you to pinpoint issues down to their root cause.
A critical aspect that is often overlooked is the need for real-time, high-fidelity metrics, which are metrics sampled at very high frequencies, often per second. In a system where millions of transactions are happening every minute, a five-minute average could hide critical spikes that may indicate system failure or degradation. Observability platforms are generally better suited to provide this level of granularity than traditional monitoring tools.
Logs: Event-Driven in Monitoring vs Queryable in Observability
Logs provide a detailed account of events and are fundamental to both monitoring and observability. However, the treatment differs.
Monitoring: Event-Driven Logs
In monitoring systems, logs are often used for event-driven alerting. For instance, a log entry indicating an elevated permissions login action might trigger an alert for potential security concerns. These logs are essential but are typically consulted only when an issue has already been flagged by the monitoring system.
Observability: Queryable Logs
In observability platforms, logs are not just passive records; they are queryable data points that can be integrated with metrics and traces for a fuller picture of system behavior. You can dynamically query logs to investigate anomalies in real-time, correlating them with other high-cardinality data to understand the ‘why’ behind an issue.
Proactive Vs Reactive
The second key difference lies in how these approaches are generally used to interact with the system.
Monitoring: Set Alerts and React
Monitoring is generally reactive. You set up alerts for known issues, and when those alerts go off, you react. It’s like having a fire alarm; it will notify you when there’s a fire, but it won’t tell you how the fire started, or how to prevent it in the future.
Observability: Continuous Exploration
Observability, by contrast, is more proactive. With an observability platform, you’re not just waiting for things to break. You’re continually exploring your data to understand how your system behaves under different conditions. This allows for more preventive measures and enables engineers to understand the system’s behavior deeply.
Opinionated Dashboards & Charts
Navigating the sprawling landscape of system data can be a daunting task, particularly as systems scale and evolve. Both monitoring and observability tools offer dashboards and charts as a solution to this challenge, but the philosophy and functionality behind them can differ significantly.
Monitoring: Pre-Built and Prescriptive Dashboards
In the realm of monitoring, dashboards are often pre-built and prescriptive, designed to highlight key performance indicators (KPIs) and metrics that are generally considered important for the majority of use-cases. For instance, a pre-configured dashboard for a database might focus on query performance, CPU usage, and memory consumption. These dashboards serve as a quick way to gauge the health of specific components within your system.
- Quick Setup: Pre-built dashboards require little to no configuration, making them quick to deploy.
- Best Practices: These dashboards are often designed based on industry best practices, providing a tried-and-true set of metrics that most organizations should monitor.
- Lack of Flexibility: Pre-built dashboards are not always tailored to your specific needs and might lack the ability to perform ad-hoc queries or deep dives.
- Surface-Level Insights: While useful for a quick status check, these dashboards may not provide the contextual data needed to understand the root cause of an issue.
Observability: Customizable and Exploratory Dashboards
Contrastingly, observability platforms often allow for much greater customization and flexibility in dashboard creation. You can build your own dashboards that focus on the metrics most relevant to your specific application or business needs. Moreover, you can create ad-hoc queries to explore your data in real-time.
- Deep Insights: Custom dashboards allow you to drill down into high-cardinality data, providing nuanced insights that can lead to effective problem-solving.
- Contextual Understanding: Because you can tailor your dashboard to include a wide range of metrics, logs, and traces, you get a more contextual view of system behavior.
- Complexity: The flexibility comes at the cost of complexity. Building custom dashboards often requires a deep understanding of the data model and query language of the observability platform.
- Time-Consuming: Crafting a dashboard that provides valuable insights can be a time-consuming process, especially if you’re starting from scratch.
Netdata aims to deliver the best of both worlds by giving you out-of-the-box opinionated, powerful, flexible, customizable dashboards for every single metric.
Monitoring Vs Observability In Real-World Applications
Understanding the key differences between monitoring and observability is pivotal, but these concepts are best illustrated through real-world use cases. Below, we delve into some sample scenarios where each approach excels, offering insights into their practical applications.
Network Performance
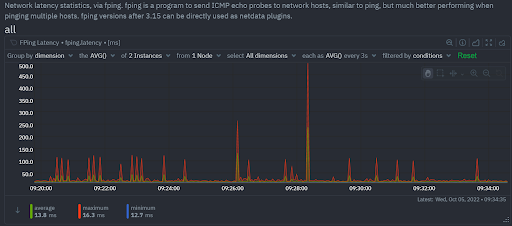
Monitoring tools are incredibly effective for tracking network performance metrics like latency, packet loss, and throughput. These metrics are often predefined, allowing system administrators to quickly identify issues affecting network reliability. For example, if a VPN connection experiences high packet loss, monitoring tools can trigger an alert, prompting immediate action.
Debugging Microservices
In a microservices architecture, services are loosely coupled but have to work in harmony. When latency spikes in one service, it can be a herculean task to pinpoint the issue. This is where observability shines. By leveraging high-cardinality data and dynamic queries, engineers can dissect interactions between services at a granular level, identifying bottlenecks or failures that are not immediately obvious.
Case Study: Transitioning From Monitoring To Observability
Consider a real-world example of a SaaS company that initially relied solely on monitoring tools. As their application grew in complexity and customer base, they started noticing unexplained latency issues affecting their API. Traditional monitoring tools could indicate that latency had increased but couldn’t offer insights into why it was happening.
The company then transitioned to an observability platform, enabling them to drill down into granular metrics and traces. They discovered that the latency was tied to a specific database query that only became problematic under certain conditions. Using observability, they could identify the issue, fix the inefficient query, and substantially improve their API response times. This transition not only solved their immediate problem but equipped them with the tools to proactively identify and address issues in the future.
The Future Of Monitoring & Observability: Synergy & Evolution
The choice between monitoring and observability isn’t binary; often, they can complement each other. Monitoring provides the guardrails that keep your system running smoothly, while observability gives you the tools to understand your system deeply, especially as it grows in complexity.
As we continue to push the boundaries of what’s possible in software development and system architecture, both monitoring and observability paradigms are evolving to meet new challenges and leverage emerging technologies. The sheer volume of data generated by modern systems is often too vast for humans to analyze in real-time. AI and machine learning algorithms can sift through this sea of information to detect anomalies and even predict issues before they occur. For example, machine learning models can be trained to recognize the signs of an impending system failure, such as subtle but unusual patterns in request latency or CPU utilization, allowing for preemptive action.
Monitoring and observability serve distinct but complementary roles in the management of modern software systems. Monitoring provides a reactive approach to known issues, offering immediate alerts for predefined conditions. It excels in areas like network performance and infrastructure health, acting as a first line of defense against system failures. Observability, on the other hand, allows for a more proactive and exploratory interaction with your system. It shines in complex, dynamic environments, enabling teams to understand the ‘why’ behind system behavior, particularly in microservices architectures and real-world debugging scenarios.
Netdata: Real-Time Metrics Meet Deep Insights
Netdata offers capabilities that span both monitoring and observability. It delivers real-time, per-second metrics, making it a powerful resource for those in need of high-fidelity data. Netdata provides out-of-the-box dashboards for every single metric as well as the capability to build custom dashboards, bridging the gap between static monitoring views and the dynamic, exploratory nature of observability. Whether you’re looking to simply keep an eye on key performance indicators or need to dig deep into system behavior, Netdata offers a balanced, versatile solution.
Check out Netdata’s public demo space or sign up today for free, if you haven’t already.
Happy Troubleshooting!


