Effective system monitoring is non-negotiable in today’s complex IT environments. Netdata offers real-time performance and health monitoring with precision and granularity. But the key to harnessing its full potential lies in the optimization of your setup. Let’s ensure you are not just collecting data, but doing it in the most optimal way while gaining actionable insights from it.
The starting point for optimization is a robust setup. Netdata is engineered for minimal footprint and can run on a wide range of hardware—from IoT devices to powerful servers. Time for a deep dive into each of these key areas and what the best practices you should follow, if you are serious about monitoring and optimizing your Netdata monitoring setup:
- Installation
- Deployment
- Optimization
- Data Retention
- Alerts & Notifications
- Rapid Troubleshooting
Installation
-
Choose the Right Installation Method for Your Environment
- Evaluate your system’s architecture, permissions, and environment to select the best installation method. For most Linux systems, the one-liner kickstart script is recommended due to its simplicity and thoroughness. However, for environments with strict security policies or limited internet access, a manual installation from source or using a package manager may be more appropriate.
-
Opt for Automatic Updates, Unless Policy Dictates Otherwise
- By default, enable automatic updates to ensure your monitoring solution benefits from the latest features and security patches. If your organization has stringent change management processes or compliance requirements, opt-out of automatic updates and establish a regular, manual update routine that aligns with your maintenance windows.
-
Select the Appropriate Release Channel Based on Your Risk Profile
- Consider your organization’s tolerance for risk when choosing between nightly and stable releases. Nightly builds offer the latest features but carry a minimal risk of introducing unanticipated issues. Stable releases, while less frequent, provide a more cautious approach, suitable for production environments where stability is paramount.
-
Ensure Proper Network Configuration for the Auto-Updater
- If utilizing the auto-updater, confirm that your network allows access to GitHub and Google Cloud Storage, as these are essential for the updater to function correctly. Proxies, firewalls, and security policies should be configured to permit the necessary outbound connections for the update process.
-
Review Hardware Requirements and Adjust Accordingly
- Before installation, assess the hardware specifications against Netdata’s requirements to ensure optimal performance. While Netdata is designed to run efficiently on various systems, tailoring it to your system’s resources will prevent potential performance bottlenecks.
These guidelines are geared towards maintaining a balance between ease of installation, system security, and operational continuity.
For more information, please check out the documentation on installation.
Deployment
Stand-alone Deployment
- Small-scale applications: This is suited for testing, home labs, or small-scale applications. It is the least complex and can be set up quickly to offer immediate visibility into system performance.
- Initial setup: It’s a perfect starting point to familiarize yourself with Netdata’s capabilities without the overhead of a distributed system.
Parent – Child Deployment
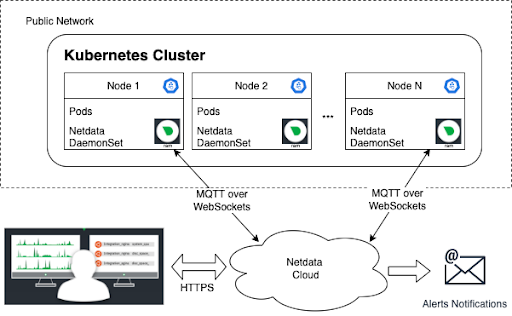
- Scalability: This model allows you to scale your monitoring setup as you grow, centralizing data collection and retention.
- Performance: Offloading tasks like long-term storage, complex queries, and alerting to the Parent can optimize the performance of the Child nodes, which can be particularly useful in production environments.
- Security: A Parent – Child setup enhances security by isolating Child nodes, potentially limiting their direct exposure to external networks.
Active–Active Parent Deployment
- High Availability: This setup aims at eliminating single points of failure by keeping data sets in sync across multiple Parents.
- Failover: Implementing a failover mechanism ensures that monitoring is maintained even if one Parent goes down.
- Complexity vs. Resilience: The trade-off here is increased complexity in configuration and resource use for the sake of resilience.
Configuration Considerations
- Security: Make sure all streaming data is encrypted and authenticated. Given your role and expertise, you might want to consider additional security layers such as TLS for data in transit.
- Data Retention and Storage: Fine-tune the data retention policies based on the criticality of the data and the available storage resources, which you seem to have planned meticulously.
- IoT Devices: Given their limited resources, tailor the Netdata Agent configuration to minimize resource consumption.
- Disaster Recovery: For all deployments, especially Active-Active, ensure you have a clear backup and disaster recovery strategy that aligns with your organizational SLAs.
- Alerting: Fine-tuning alerting thresholds and deduplication settings is essential to avoid alert fatigue, especially in larger deployments.
Further Considerations
- Testing: Before full-scale deployment, conduct thorough testing of each configuration to ensure it meets the load and performance expectations.
- Documentation: Maintain detailed documentation of your configuration changes and deployment architecture.
- Automation: As a technical product manager, leveraging infrastructure as code for deployment could facilitate scalability and maintainability.
Recommendations
- Deploy in Stages: Start with a stand-alone deployment, proceed to a Parent – Child model, and then consider an Active–Active setup as your infrastructure grows and the need for high availability becomes paramount.
- Performance Monitoring: Actively monitor the performance of the Netdata Agents and Parents to ensure they are operating within the resource constraints of your devices.
- Security Policies: Review and regularly update security policies, especially if your deployment involves IoT devices, which can be potential entry points for security threats.
Here’s a detailed guide about the different deployment options.
Optimization
To optimize the performance of the Netdata Agent for data collection in a production environment, consider the following strategies:
-
Use Streaming and Replication:
- This setup allows offloading the storage and analysis of metrics to a Parent node, which can be more powerful and not affect the production system’s performance.
- By doing so, you ensure that the data is synchronized across your infrastructure and that in the case of a node failure, you have the metrics available for post-mortem analysis.
-
Disable Unnecessary Plugins or Collectors:
- Analyze which plugins or collectors are not required for your specific use case and disable them to reduce unnecessary resource consumption.
- Keep in mind that if a plugin or collector does not find what it needs to collect data on, it exits, so disabling those actively collecting unwanted metrics would be the priority.
-
Reduce Data Collection Frequency:
- By increasing the interval between data collections (
update everysetting), you reduce CPU and disk I/O operations at the cost of less granularity in your metrics. - For specific collectors where high-resolution data is not critical, adjust their individual collection frequency.
- By increasing the interval between data collections (
-
Adjust Data Retention Period:
- If long-term historical data is not essential, consider reducing the duration Netdata stores metrics to free up disk space and reduce disk I/O pressure.
- For IoT devices or child nodes in a streaming setup, a shorter retention period might be advisable unless historical data is crucial.
- We will cover data retention in more detail in the next section.
-
Opt for Alternative Metric Storage:
- Depending on the hardware constraints, considering an alternative database for metric storage that’s more efficient in terms of I/O operations can be beneficial.
- In a Parent-Child configuration, the child nodes could be configured to use the
memory moderam or save for a lighter footprint.
-
Disable Machine Learning (ML) on Child Nodes:
- The ML feature consumes additional CPU resources. It can be disabled on child nodes to ensure that resources are dedicated to the essential tasks of the production environment.
- Reserve ML capabilities for Parent nodes or systems where resources are less constrained.
-
Run Netdata Behind a Proxy:
- Using a reverse proxy like NGINX can improve the robustness of connections and data transmission efficiency.
- It can manage more concurrent connections and employ faster gzip compression, thus saving CPU resources on the agent itself.
-
Adjust or Disable Gzip Compression:
- Gzip compression on the Netdata dashboard helps reduce network traffic but can increase CPU usage.
- If the dashboard is not accessed frequently or network bandwidth is not a concern, consider reducing the compression level or disabling it.
-
Disable Health Checks on Child Nodes:
- Offload health checks to Parent nodes to conserve resources on children nodes, simplifying configuration management.
- This strategy focuses resources on data collection rather than evaluation.
-
Fine-tuning for Specific Use Cases:
- Tailor the configuration to your specific hardware and use case, since default settings are designed for general use.
- For instance, if running on high-performance VMs, you might opt for more granular data without significant resource impact.
Following these recommendations should lead to a more efficient Netdata deployment. If you’d like to understand more, please read the documentation.
Data Retention
Optimizing data retention in Netdata involves balancing between the resolution of historical data, the system’s resource allocation, and the specific use cases for the data. Here are five best practices that could serve as guidelines:
-
Define Retention Goals Clearly: Before adjusting any settings, have a clear understanding of your retention needs. Consider how long you need to keep detailed data and what granularity is necessary. For instance, if you need high-resolution data for troubleshooting recent issues but only summary data for long-term trends, you can set up your storage tiers to reflect that.
-
Use Tiered Storage Effectively: Netdata’s tiered storage system allows you to define different retention periods for different levels of detail. Use this feature to store high-frequency data for a short period and lower-frequency, aggregated data for longer. Configure the tiers to balance between the resolution and the amount of disk space you’re willing to allocate. For example, a common approach might be to retain highly detailed, per-second data for a few days, per-minute data for several weeks, and hourly data for a year or more.
-
Optimize Disk Space Allocation: Allocate disk space thoughtfully among the tiers. If you have a fixed amount of disk space, consider the importance of each tier’s data and allocate more space to the tiers that store the most valuable metrics for your use case. Remember, more space for Tier 0 means more high-resolution data, which is critical for short-term analysis.
-
Manage Memory Consumption: Be aware of the impact of data retention on memory usage. As retention requirements increase, so does the DBENGINE’s memory footprint. To manage memory effectively, monitor the actual usage closely and adjust the
dbengine page cache size MBas needed to ensure that the DBENGINE does not consume more memory than is available, which can lead to system swapping or other performance issues. -
Regularly Monitor and Adjust Settings: Monitor the performance and effectiveness of your settings regularly using the
/api/v1/dbengine_statsendpoint. As your infrastructure grows and changes, so too will your metric volume and the effectiveness of your current retention strategy. Be proactive in adjusting settings to ensure your retention continues to meet your needs without unnecessarily consuming system resources.
When implementing these practices, always consider the nature of your data and its usage patterns. Some environments with highly ephemeral metrics, like those with many short-lived containers, may require different settings compared to more stable infrastructures..
For more information on updating your data retention settings, read the documentation.
Alerts
-
Customize Alert Thresholds: Adjust the thresholds for each alert based on the unique performance characteristics of your environment. Use historical data and patterns to set thresholds that accurately reflect normal and abnormal states, thus minimizing false positives and negatives.
-
Dynamic Thresholds and Hysteresis: Implement dynamic thresholds to adjust to your environment’s changing conditions, and use hysteresis to prevent alert flapping. This ensures alerts are responsive to genuine issues rather than normal metric variability.
-
Prioritize and Classify Alerts: Clearly define the severity of alerts to differentiate between critical issues that require immediate action and warnings for events that are less urgent. This helps in managing the response times appropriately and prevents alert fatigue.
-
Silence During Predictable Events: Utilize the health management API to temporarily disable or silence alerts during scheduled maintenance, backups, or other known high-load events to avoid a flood of unnecessary alerts.
-
Regular Reviews: Regularly review and update your alert configurations to ensure they remain aligned with the current state and needs of your infrastructure. Keep your Netdata configuration files in a version control system to track changes and facilitate audits.
By focusing on these practices, you can enhance the efficiency and reliability of your monitoring system, ensuring that it serves as a true aid in the observability of your infrastructure.
The extensive alerts documentation goes into everything you need to know about configuring alerts.
Rapid Troubleshooting
Netdata’s anomaly detection and metrics correlation features are great tools for rapid troubleshooting.
-
Utilize Built-In Anomaly Detection: Leverage the out-of-the-box anomaly detection for each metric. Since Netdata uses unsupervised machine learning, it does not require labeled data to identify anomalies. This feature can save time and provide immediate insights into unusual system behavior without extensive configuration.
-
Monitor Anomaly Indicators: Keep a close eye on the anomaly indicators present on the charts and summary panels. The visual cues—shades of purple—are integral to quickly assessing the severity and presence of anomalies. Adjust your monitoring setup to ensure these indicators are clear and easily noticeable.
-
Engage with the Anomalies Tab for Deep Dives: When an anomaly is detected, use the anomalies tab for a granular inspection of the data. This feature is crucial for identifying the start of an anomaly within a specific metric or group of metrics and observing its potential cascading effect through your infrastructure.
-
Metrics Correlation: When running Metric Correlations from the Overview tab across multiple nodes, you might find better results if you iterate on the initial results by grouping by node to then filter to nodes of interest and run the Metric Correlations again. Run MC on all nodes. Within the initial results returned group the most interesting chart by node to see if the changes are across all nodes or a subset of nodes. If you see a subset of nodes clearly jump out when you group by node, then filter for just those nodes of interest and run the MC again. This will result in less aggregation needing to be done by Netdata and so should help give clearer results as you interact with the slider.
-
Choose the right algorithm: Use the Volume algorithm for metrics with a lot of gaps (e.g. request latency when there are few requests), otherwise stick with KS2.
To explore all the options to configiure machine learning, you can read more in the documentation.
Go forth and optimize!
Ultimately, an optimized Netdata setup is a living system that demands attention and iteration. By fostering an environment where continuous review is part of the culture, your infrastructure will not just keep pace but set the pace in a landscape that is perpetually evolving.
With Netdata’s full suite of features finely tuned to your operational needs, your monitoring will not just inform you—it will empower you.
If you are intrigued, you can also start by exploring one of our Netdata demo rooms here.
Happy Troubleshooting!


