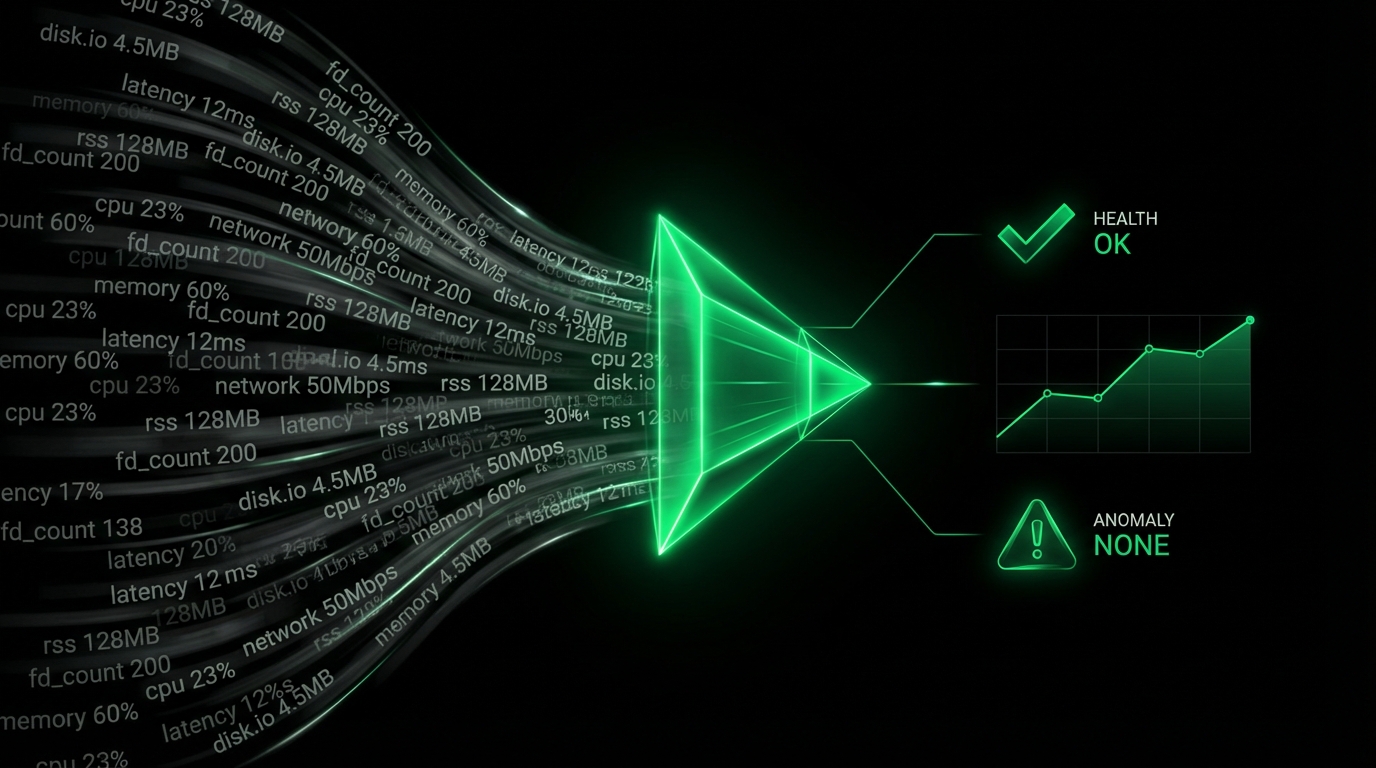
In the digital era, where data flows like a ceaseless river, real-time monitoring stands as a pivotal technology, allowing organizations to not only keep pace but also to deeply understand the intricate dance of their operational ecosystems. This technology is not just about keeping tabs; it’s about gaining a profound, almost intuitive sense of the micro-worlds within which systems, containers, services, and applications pulse and thrive.
Real-time monitoring is the art and science of tracking system performance, activities, or transactions continuously and automatically, providing the ability to analyze and visualize data the moment it’s generated.
Beyond the practicality of immediate response, real-time monitoring offers an unparalleled level of understanding. Stakeholders can ‘feel the pulse and breath’ of their infrastructure, witnessing every heartbeat and fluctuation. This intimate connection with the system’s inner workings fosters a deeper comprehension, enabling users to anticipate issues, optimize operations, and innovate with greater agility.
Concept of Real-Time in Different Contexts
Real-time monitoring is a multifaceted concept that adapts its significance and implementation based on the specific demands and nuances of different industries and applications. Despite this versatility, at its core, real-time monitoring shares a set of fundamental principles that define its essence and operational imperatives.
- Finance: In the financial sector, real-time monitoring is synonymous with the precision required for trading systems, where delays can result in significant financial loss. Here, real-time means capturing market movements and executing trades with the smallest possible latency.
- Healthcare: In healthcare, real-time monitoring is crucial for patient care, where it translates to continuous observation of vital signs to provide immediate care or intervention. The definition of real-time in this context emphasizes timely data that can influence life-saving decisions.
- Manufacturing: For manufacturing, real-time monitoring ensures operational efficiency and safety. It involves tracking production processes, machinery health, and environmental conditions to instantly detect and rectify disruptions or hazards.
- E-Commerce: In e-commerce, real-time monitoring focuses on user experience, ensuring website performance and transaction processes operate seamlessly to prevent customer drop-off and optimize engagement.
- Cybersecurity: Real-time in cybersecurity means immediate detection and response to threats, ensuring that breaches are identified and mitigated swiftly to protect data integrity and confidentiality.
Real-time monitoring is not just a technical requirement, but a strategic asset that offers deep insights into the operational health of various systems across industries.
Core Components of Real-Time Monitoring
Real-time monitoring systems consist of several integral components that work in concert to provide timely insights and enable swift action. Understanding these core components is crucial for designing, evaluating, or enhancing real-time monitoring capabilities.
Data Collection
Data collection is the foundational step in real-time monitoring, involving the continuous acquisition of data from various sources, such as sensors, logs, user activities, processes, network connections, etc.
The key characteristics are:
- Granularity: Data must be collected frequently, to provide high-resolution insights and ensure its relevance. The more frequently data is collected, the more real-time the system is.
- Cardinality & Scalability: As the volume of data or the number of sources increases, the collection system should maintain its performance without degradation.
- Reliability: The collection process should be robust, ensuring data integrity and minimizing loss or corruption.
- Diversity: Collection mechanisms should be versatile, capable of handling various data types and formats from different sources.
Data Processing
Once data is collected, it must be processed rapidly to convert raw data into actionable insights. This includes filtering, aggregation, correlation, and analysis of data in real-time.
The key characteristics are:
- Latency: Processing must be fast enough to keep up with the incoming data stream and provide timely insights.
- Efficiency & Scalability: Algorithms and processing mechanisms should be optimized to handle high volumes of data with minimal resource consumption.
- Accuracy: Data processing should maintain the fidelity of the data, ensuring that insights are based on reliable and precise information.
- Flexibility: The processing system should be adaptable to various data processing requirements and capable of evolving with changing data patterns.
Data Retention
Data retention in real-time monitoring refers to the system’s capability to store, manage, and retrieve the vast volumes of high-resolution data generated. Efficient data retention is crucial for historical analysis, trend observation, regulatory compliance, and forensic investigations.
The key characteristics are:
- Efficiency: The system must store data in a manner that optimizes space utilization without compromising data integrity or access speed.
- Scalability: As data volume grows, the retention system should scale effectively, maintaining performance and ensuring data is neither lost nor degraded.
- Accessibility: Retained data should be easily accessible for analysis and reporting, with mechanisms in place to query and retrieve data swiftly.
- High-Resolution Storage: The system should maintain the granularity of data, storing it at a high resolution to enable detailed analysis. This is particularly important for systems where historical data can provide insights into trends, patterns, or anomalies over time.
Data Visualization
Visualization translates processed data into a human-readable format, providing intuitive interfaces for users to understand and interact with the data in real-time.
The key characteristics are:
- Clarity: Visualizations should convey information clearly and effectively, allowing users to quickly grasp the situation.
- Interactivity: Users should be able to drill down, filter, or manipulate the visualization to explore the data in detail.
- Customizability: The visualization component should offer customization options to cater to different user preferences and requirements.
- Real-time Update: Visual representations should update dynamically, reflecting the most current data without requiring manual refresh.
Together, these components form the backbone of real-time monitoring systems, ensuring that data is not only collected and analyzed promptly but also made accessible and actionable for users, facilitating informed decision-making and timely responses in dynamic environments.
Why is Real-Time Monitoring So Challenging?
Real-time monitoring is a sophisticated technology that operates under the principle of immediacy, aiming to capture, process, and visualize data almost instantaneously. While its benefits are immense, achieving real-time capabilities is fraught with challenges that span technical, operational, and scalability aspects.
The sheer volume of data generated by modern systems is staggering. In real-time monitoring, data must be captured at the very moment it is generated. As the number of data sources grows, so does the influx of data, which can be overwhelming. Processing this data in real-time, ensuring no loss or latency, is a monumental task, requiring robust and efficient systems.
The pipeline that queries data sources, processes the collected data points, stores them, and makes them available for visualization and alerts, has to be designed so that:
- It is fast enough to keep up the pace samples are coming in, processed, and stored,
- It is optimized enough to minimize compute resources consumption (CPU, memory, disk I/O, and disk space).
As organizations grow, so do their data and monitoring needs. A real-time monitoring system must be scalable to handle increasing volumes of data without performance degradation. This requires a well-thought-out architecture that can expand horizontally (adding more servers or nodes) and vertically (enhancing the capabilities of existing servers). Achieving this scalability while maintaining real-time performance is a significant challenge, usually involving:
- Network bandwidth consumption,
- The cost of compute resources for maintaining an ingestion rate that high,
- When central monitoring resources cross the maximum ingestion capacity vertical scaling can provide, they must scale horizontally (sharding, partitioning, etc).
In other words, at the point that the infrastructure becomes so big, that there is no single server powerful enough for ingesting all the data, they need to find a way to have multiple servers ingesting data in parallel, while still maintaining a unified view at visualization and alerting.
The trade-off between granularity (how detailed the data is) and cardinality (the number of distinct data series) is a key challenge in real-time monitoring. Higher granularity provides more detailed insights but requires more resources to capture, store, and process. Similarly, high cardinality offers a broader or deeper perspective but exacerbates the data volume challenge.
To say this differently, a system that collects 2000 metrics per second per node, has to do 100 times more work, compared to a system that collects 200 metrics every 10 seconds.
When a distributed architecture is chosen (like in Netdata) to overcome the granularity and cardinality limitations, data is scattered across different locations or environments. Aggregating this data to present a unified, coherent view in real-time is challenging. It requires sophisticated synchronization mechanisms and data integration techniques to ensure that the data presented is consistent and up-to-date.
The complexity of real-time monitoring arises from the need to balance immediacy with accuracy, detail with breadth, and scalability with cost-efficiency. It’s a dynamic field that requires continuous innovation to address the evolving challenges of data-driven environments. Understanding these challenges is crucial for anyone looking to implement or enhance real-time monitoring systems, ensuring they are prepared to navigate the intricate landscape of real-time data analysis.
Comparative Analysis of Real-Time Monitoring Solutions
In the realm of monitoring solutions, real-time capabilities vary significantly. To elucidate this, we compare several prevalent monitoring solutions based on their out-of-the-box real-time monitoring capabilities. The focus is on default settings, as these are indicative of the immediate value each solution provides.
We evaluate:
- Traditional check-based systems like Nagios, Icinga, Zabbix, Sensu, PRTG, SolarWinds.
- Popular commercial offerings like Datadog, Dynatrace, NewRelic, Grafana Cloud, Instana.
- A custom setup of Prometheus and Grafana configured for per-second data collection.
- Netdata with default settings, as it is out of the box.
Keep in mind that one way or another, many monitoring solutions have the ability for some real-time aspect. However, we are interested in what they do out of the box, by default.
These systems can be classified as follows:
Traditional Check-Based Systems
E.g., Nagios, Icinga, Zabbix, PRTG, Sensu, SolarWinds.
These systems generally operate with per-minute data collection and retention, placing them outside the real-time category.
Popular Commercial Offerings
Traditional check-based systems like Nagios, Icinga, Zabbix, Sensu, PRTG, SolarWinds.
Popular commercial offerings like Datadog, Dynatrace, NewRelic, Grafana Cloud, Instana.
A custom setup of Prometheus and Grafana configured for per-second data collection.
Netdata with default settings, as it is out of the box.
Keep in mind that one way or another, many monitoring solutions have the ability for some real-time aspect. However, we are interested in what they do out of the box, by default.
These systems can be classified as follows:
Traditional check-based systems
- E.g. Nagios, Icinga, Zabbix, PRTG, Sensu, SolarWinds.
- These systems generally operate with per-minute data collection and retention, placing them outside the real-time category.
Popular Commercial Offerings
Dynatrace, NewRelic, Grafana Cloud These systems also generally operate with per-minute data collection and retention, placing them outside the real-time category.
Datadog
- Datadog has a data collection frequency of 15-seconds. Not real-time enough, but still a lot better compared to the previous ones.
- Apart from the low data collection rate, Datadog has the following issues preventing its classification as a real-time monitoring system:
- It has a variable data processing latency. There are numerous reports online from users stating that sometimes data needs several minutes to appear on the dashboards.
- In our tests, we observed Datadog dashboards faking data collections. For example, we stopped a container and Datadog dashboards were still presenting new samples for several minutes, while the container was stopped.
- It has low accuracy. To test this, we paused a few VMs for a couple of minutes and then we resumed them. Datadog did not notice that. It was always presenting a continuous flow of data, despite the fact that it missed several data collections.
Instana
- Instana has per-second data collection, however there are a couple issues that prevent classifying it as real-time:
- It retains per-second data for only 24-hours. Then it falls back to per-minute. This means that on Monday, you cannot see high-resolution views of Saturday.
- The integrations available are very limited and only some of the available ones collect data per-second.
- It is a centralized design, which means it has a hard cap on scalability.
Custom Prometheus and Grafana, configured for per-second collection
- Prometheus allows configuring data collection per-second, so we need to evaluate this combination too.
- The key issues of this setup are:
- Low reliability. Prometheus does not work in a beat. The data collection interval can fluctuate, but more importantly missed data collections are not stored in the database. This means that Grafana dashboards can only show gaps based on statistical algorithms.
- Low scalability. Prometheus is a central time-series database. Of course, there are solutions to improve this, like Thanos, but these solutions increase complexity drastically.
- Visualization clarity and interactivity is almost non-existing. This lies in the fact that Grafana is mainly a visualization designer / editor. So, Grafana has assumed that users already know what they visualize and there is no need to provide any information to help users grasp the dataset better. There is nothing to help users understand cardinality, filtering is available at dashboard level not chart level and dicing the data requires writing complex and cryptic PromQL queries.
- Dashboard updates are every 5 seconds at best, or manually. To control query load on the backend servers (Prometheus), Grafana has limited its automatic refresh rate to every 5 seconds.
Netdata
- Netdata emerges as a comprehensive real-time monitoring solution with:
- Per-second data collection,
- 1-second data collection to visualization latency, working at a beat,
- Missed data collection points are stored in the database and are visualized,
- 0.5 bytes per sample on disk for the high resolution tier,
- Per second dashboard refreshes,
- Machine learning based anomaly detection, as a standard, analyzing the patterns and finding anomalies during data collection,
- Decentralized architecture for building high performance pipelines of vast capacity,
- Full transparency and clarity at visualization level, on all facets of a dataset, to help users quickly understand the data sources and their contribution to each chart.
- The resources Netdata requires for all these, are less than what most other monitoring systems require, making Netdata one of the most lightweight monitoring solutions.
- Netdata emerges as a comprehensive real-time monitoring solution with:
This is the full comparison:
| Check-based systems | Popular Commercial Offerings | Custom Prometheus (per-sec) + Grafana | Netdata | |||
Systems | Nagios, Icigna, Zabbix, Sensu, SolarWinds, PRTG | Dynatrace, NewRelic, Grafana Cloud | Datadog | Instana | Prometheus + Grafana | Netdata |
Data Collection | ||||||
Granularity | 1-minute | 1-minute | 15-seconds | 1-second | 1-second | 1-second |
Cardinality | Very Low | Low | Average | Very Low | High (a lot of integrations but a lot of moving parts too) | Excellent (a lot of integrations, one moving part, all out of the box) |
Reliability | High | Low (absence of samples is not indicated) | Low (absence of samples is not indicated) | Excellent (stores gaps too) | Low (absence of samples is not indicated) | Excellent (stores gaps too) |
Diversity | Average | Average | Average | Low (very few integrations) | High (a lot of integrations but a lot of moving parts too) | Excellent (a lot of integrations, one moving part) |
Scalability | Low (centralized design) | Irrelevant (this is the providers’ cost) | Irrelevant (this is the providers’ cost) | Low (centralized design) | Low (centralized design) | Excellent (decentralized design) |
Data Processing | ||||||
Latency (work in a beat) | Variable | Variable | Variable | Excellent | Variable | Excellent |
Accuracy | High (failed checks are visualized) | Low (missing data are interpolated) | Low (missing data are interpolated) | Excellent (missing data are important) | Low (missing data are interpolated) | Excellent (missing or partial data are visualized) |
Machine Learning | No | Poor (partial, or no machine learning) | Poor (partial, or no machine learning) | Poor (partial, or no machine learning) | No | Excellent (inline with data collection, for all metrics) |
Data Retention | ||||||
Efficiency | Low (not designed for this) | Irrelevant (this is the providers’ cost) | Irrelevant (this is the providers’ cost) | Low (high-res retention is limited to 24 hours) | Low (2+ bytes per sample, gaps are not stored, huge I/O) | Excellent (0.5 bytes per sample, storing gaps too, low I/O) |
Scalability | Low (centralized design) | Irrelevant (this is the providers’ cost) | Irrelevant (this is the providers’ cost) | Low (centralized design, limited high-res retention) | Low (centralized design) | Excellent (decentralized design) |
Data Visualization | ||||||
Clarity | High | Low (not easy to grasp the sources contributing, gaps are interpolated) | Low (not easy to grasp the sources contributing, gaps are interpolated) | Average (not easy to grasp the sources contributing) | Low (not easy to grasp the sources contributing) | Excellent (multi-facet presentation for every chart, gaps and partial data visualized) |
Interactivity | None (not enough data for further analysis) | Low (slicing and dicing requires editing queries) | High | Low (not enough cardinality for further analysis) | Low (slicing and dicing requires editing queries) | Excellent (point and click slicing and dicing) |
Customizability | None (it is what it is) | Average (custom dashboards) | High (custom dashboards, integrated) | None (it is what it is) | High (custom dashboards that can visualize anything) | Excellent (custom dashboards with drag and drop, settings per chart) |
Real-time Updates | Low (per minute, or upon request) | Low (per minute) | Average (every 10-seconds) | Excellent (per-second) | High (every 5-seconds, or on demand) | Excellent (per second) |
Epilogue
As we draw the curtain on this comprehensive exploration of real-time monitoring and the distinguished position of Netdata in this dynamic landscape, it’s imperative to reflect on the journey that has led us here. The creation and evolution of Netdata is not just a testament to technological innovation but a narrative of commitment to making intricate system data accessible, understandable, and actionable in real-time.
Netdata, born out of the need for immediate, granular, and reliable insights into systems, has evolved into a beacon of excellence in the realm of real-time monitoring. It stands as a testament to the vision of creating a tool that not only meets the technical demands of modern-day infrastructure monitoring but also democratizes access to critical data insights, empowering users across the spectrum of expertise.
The discussions laid out in this blog are more than a showcase of Netdata’s capabilities; they are an invitation to reimagine what real-time monitoring can and should be. They underscore a commitment to a future where operational agility, informed decision-making, and technological resilience are not just ideals but everyday realities.
We extend our heartfelt gratitude to you, the community, for embarking on this journey with us. Your insights, feedback, and engagement have been instrumental in shaping Netdata into the robust solution it is today. As we continue to navigate the ever-evolving technological landscape, our mission remains steadfast—to provide a monitoring solution that is not only real-time but also real-relevant, real-resilient, and real-responsive to the needs of our users.
Thank you for joining us on this journey of exploration, understanding, and innovation. Together, we are not just monitoring the present; we are shaping the future of real-time data interaction, one second at a time.
