In the dynamic landscape of modern infrastructure and multi cloud environments, observing and understanding system performance requires a new breed of tools—ones that keep pace with the ‘living’ nature of modern infrastructure. This is the inflection point at which Netdata steps in, and aims to bring a fresh perspective to monitoring.
What does Netdata do differently
There are key “cultural” faults that we believe hold the observability industry back. Let’s take a look through the prism of these faults and understand what Netdata is doing differently to address them.
If it’s not per-second, it’s not real-time
In a world where even milliseconds can make a difference, the common practice of monitoring with intervals of 10, 30, or even 60 seconds is akin to driving by looking in the rearview mirror. Cloud performance for example is neither linear nor predictable, and high-resolution metrics are critical.
Netdata commits to per-second data collection, giving a real-time view of what’s happening. This granularity allows for the early detection of issues before they escalate. This commitment means per-second data collection is not just an available option but the default and the expectation for every single of the thousands of metrics Netdata collects.
Stop Cherry-Picking Metrics:
Selectively monitoring certain metrics while ignoring others is a gamble that can hide the full story of an issue. Netdata champions a comprehensive approach. By digesting, correlating, and visualizing the full spectrum of available metrics, we offer deeper insights without burdening the infrastructure—or the budget.
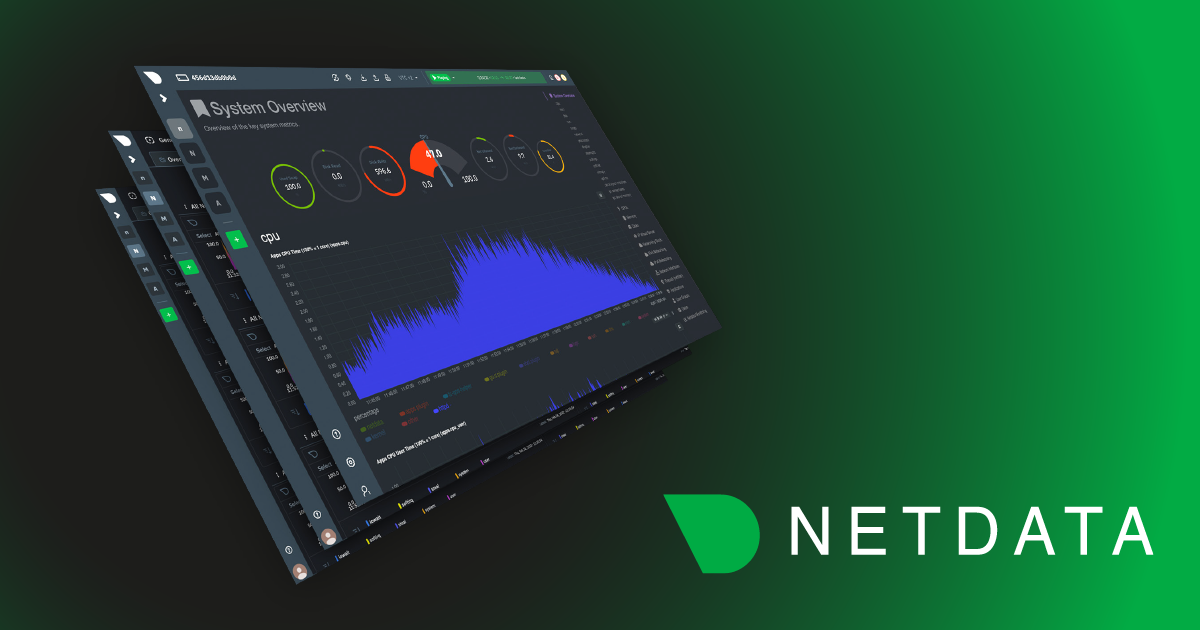
Every single metric that Netdata collects has a chart on the Netdata dashboard - by default. So when it’s 3AM and you’re fighting an outage, the charts you need already exist and do not need to be created after the fact.
Data Rich, Insight Poor:
IT monitoring isn’t a job for data scientists; it’s a job for developers and operations teams who need actionable insights, not just data dumps. Netdata leverages advanced data science techniques behind the scenes to distill complex data into clear, actionable information. This enables our users to focus on resolving issues, not deciphering data.
Don’t start with an expectation of expertise
No single person can claim an encyclopedic knowledge of all available metrics and their implications. Netdata acts as a knowledgeable partner, embedding this expertise into our tools to aid users in understanding the what, why, and how of their system metrics.
The Query Editor Conundrum:
Query editors often work on the assumption that you know the question you need to ask. We believe in flipping that script. Netdata’s approach seeks to provide the answers first, helping you backtrack to the root cause—essentially revealing the question you didn’t know you had to ask.
Hand crafting dashboards & alerts is Inefficient
The laborious task of crafting dashboards and alerts one metric and chart at a time is an inefficient use of precious time. Netdata provides pre-configured dashboards and alerts tailored for standardized systems and applications, streamlining the setup process and enabling you to monitor effectively from the get-go.
Decentralizing Architecture:
Centralization of metrics into a single data store poses a bottleneck and escalates costs. Netdata’s fully decentralized deployment model bypasses this issue. It allows for infinite horizontal and vertical scaling, optimizes costs, and ensures that total cost of ownership remains unrivaled.
Netdata vs The Competition
Now that we’ve gone through the key aspects of the Netdata monitoring methodology, let us take a deeper look at how Netdata compares against most of the competing observability solutions out there today.
| Feature | Netdata | The Competition |
|---|---|---|
| Data Collection | 1 second granularity, for all metrics, designed for troubleshooting emerging issues in real-time with high-fidelity data. | Not real-time. Granularity varies per type of metric, and time frame, and is measured in minutes and not seconds. |
| Time to value | Potentially just minutes. Designed for engineers, to be used immediately after installation. | Typically weeks. Steep, challenging and sometimes a torture. You have to learn each and every metric, new workflows, and become an expert. |
| Dashboards | Every single metric is visualized in meaningful, fully automated dashboards. Custom dashboards are supported but not necessary. | Pre-packaged dashboards do not include every single metric. Building custom dashboards is time consuming and necessary. |
| Data Privacy | Your data is stored at the source, your premises – we don’t store it, and can’t share it or sell it. | Most commercial monitoring solutions store your data on their cloud and visualise them centrally. |
| Scalability | Exceptional vertical and horizontal scalability while handling high data volume and velocity. Minimal traffic egress costs. | Often struggles with scalability challenges such as high data volumes, resource constraints, and high traffic egress costs. |
| Community | Netdata has an active and vibrant open source community and is (as of date) the leading observability project on the the CNCF landscape,. | Commercial solutions lack the diversity and vibrancy of OSS communities. |
| Cost of Ownership | Cost-effective and transparent pricing. Zero hidden costs. | Often carries hidden costs that increase the Total Cost of Ownership (TCO) over time. |
The Netdata monitoring methodology isn’t just different—it’s a leap forward. Sign up today to experience it first hand.
Happy Troubleshooting.


