Netdata reads /proc/<pid>/stat for all processes, once per second and extracts utime and
stime (user and system cpu utilization), much like all the console tools do.
But it also extracts cutime and cstime that account the user and system time of the exit children of each process.
By keeping a map in memory of the whole process tree, it is capable of assigning the right time to every process, taking
into account all its exited children.
It is tricky, since a process may be running for 1 hour and once it exits, its parent should not receive the whole 1 hour of cpu time in just 1 second - you have to subtract the cpu time that has been reported for it prior to this iteration.
It is even trickier, because walking through the entire process tree takes some time itself. So, if you sum the CPU utilization of all processes, you might have more CPU time than the reported total cpu time of the system. Netdata solves this, by adapting the per process cpu utilization to the total of the system.
Comparison with console tools
SSH to a server running Netdata and execute this:
while true; do ls -l /var/run >/dev/null; done
In most systems /var/run is a tmpfs device, so there is nothing that can stop this command
from consuming entirely one of the CPU cores of the machine.
As we will see below, none of the console performance monitoring tools can report that this command is using 100% CPU. They do report of course that the CPU is busy, but they fail to identify the process that consumes so much CPU.
Here is what common Linux console monitoring tools report:
top
top reports that bash is using just 14%.
If you check the total system CPU utilization, it says there is no idle CPU at all, but top
fails to provide a breakdown of the CPU consumption in the system. The sum of the CPU utilization
of all processes reported by top, is 15.6%.
top - 18:46:28 up 3 days, 20:14,  2 users,  load average: 0.22, 0.05, 0.02
Tasks:  76 total,   2 running,  74 sleeping,   0 stopped,   0 zombie
%Cpu(s): 32.8 us, 65.6 sy,  0.0 ni,  0.0 id,  0.0 wa,  1.3 hi,  0.3 si,  0.0 st
KiB Mem :  1016576 total,   244112 free,    52012 used,   720452 buff/cache
KiB Swap:        0 total,        0 free,        0 used.   753712 avail Mem

  PID USER      PR  NI    VIRT    RES    SHR S %CPU %MEM     TIME+ COMMAND
12789 root      20   0   14980   4180   3020 S 14.0  0.4   0:02.82 bash
    9 root      20   0       0      0      0 S  1.0  0.0   0:22.36 rcuos/0
  642 netdata   20   0  132024  20112   2660 S  0.3  2.0  14:26.29 netdata
12522 netdata   20   0    9508   2476   1828 S  0.3  0.2   0:02.26 apps.plugin
    1 root      20   0   67196  10216   7500 S  0.0  1.0   0:04.83 systemd
    2 root      20   0       0      0      0 S  0.0  0.0   0:00.00 kthreadd
htop
Exactly like top, htop is providing an incomplete breakdown of the system CPU utilization.
  CPU[||||||||||||||||||||||||100.0%]   Tasks: 27, 11 thr; 2 running
  Mem[||||||||||||||||||||85.4M/993M]   Load average: 1.16 0.88 0.90
  Swp[                         0K/0K]   Uptime: 3 days, 21:37:03

  PID USER      PRI  NI  VIRT   RES   SHR S CPU% MEM%   TIME+  Command
12789 root       20   0 15104  4484  3208 S 14.0  0.4 10:57.15 -bash
 7024 netdata    20   0  9544  2480  1744 S  0.7  0.2  0:00.88 /usr/libexec/netd
 7009 netdata    20   0  138M 21016  2712 S  0.7  2.1  0:00.89 /usr/sbin/netdata
 7012 netdata    20   0  138M 21016  2712 S  0.0  2.1  0:00.31 /usr/sbin/netdata
  563 root	     20   0  308M  202M  202M S  0.0 20.4  1:00.81 /usr/lib/systemd/
 7019 netdata    20   0  138M 21016  2712 S  0.0  2.1  0:00.14 /usr/sbin/netdata
atop
atop also fails to break down CPU usage.
ATOP - localhost            2016/12/10  20:11:27    -----------      10s elapsed
PRC | sys    1.13s | user   0.43s | #proc     75 | #zombie    0 | #exit   5383 |
CPU | sys      67% | user     31% | irq       2% | idle      0% | wait      0% |
CPL | avg1    1.34 | avg5    1.05 | avg15   0.96 | csw    51346 | intr   10508 |
MEM | tot   992.8M | free  211.5M | cache 470.0M | buff   87.2M | slab  164.7M |
SWP | tot     0.0M | free    0.0M |              | vmcom 207.6M | vmlim 496.4M |
DSK |          vda | busy      0% | read       0 | write      4 | avio 1.50 ms |
NET | transport    | tcpi      16 | tcpo      15 | udpi       0 | udpo       0 |
NET | network      | ipi       16 | ipo       15 | ipfrw      0 | deliv     16 |
NET | eth0    ---- | pcki      16 | pcko      15 | si    1 Kbps | so    4 Kbps |

  PID SYSCPU USRCPU   VGROW  RGROW  RDDSK   WRDSK ST EXC  S  CPU CMD       1/600
12789  0.98s  0.40s      0K     0K     0K    336K --   -  S  14% bash
    9  0.08s  0.00s      0K     0K     0K      0K --   -  S   1% rcuos/0
 7024  0.03s  0.00s      0K     0K     0K      0K --   -  S   0% apps.plugin
 7009  0.01s  0.01s	     0K     0K     0K      4K --   -  S   0% netdata
glances
And the same is true for glances. The system runs at 100%, but glances reports only 17%
per process utilization.
Note also, that being a python program, glances uses 1.6% CPU while it runs.
localhost                                               Uptime: 3 days, 21:42:00

CPU  [100.0%]   CPU     100.0%   MEM     23.7%   SWAP      0.0%   LOAD    1-core
MEM  [ 23.7%]   user:    30.9%   total:   993M   total:       0   1 min:    1.18
SWAP [  0.0%]   system:  67.8%   used:    236M   used:        0   5 min:    1.08
                idle:     0.0%   free:    757M   free:        0   15 min:   1.00

NETWORK     Rx/s   Tx/s   TASKS  75 (90 thr), 1 run, 74 slp, 0 oth
eth0        168b    2Kb
eth1          0b     0b     CPU%  MEM%   PID USER        NI S Command
lo            0b     0b     13.5   0.4 12789 root         0 S -bash
                             1.6   2.2  7025 root         0 R /usr/bin/python /u
DISK I/O     R/s    W/s      1.0   0.0     9 root         0 S rcuos/0
vda1           0     4K      0.3   0.2  7024 netdata      0 S /usr/libexec/netda
                             0.3   0.0     7 root         0 S rcu_sched
FILE SYS    Used  Total      0.3   2.1  7009 netdata      0 S /usr/sbin/netdata
/ (vda1)   1.56G  29.5G      0.0   0.0    17 root         0 S oom_reaper
why does this happen?
All the console tools report usage based on the processes found running at the moment they
examine the process tree. So, they see just one ls command, which is actually very quick
with minor CPU utilization. But the shell, is spawning hundreds of them, one after another
(much like shell scripts do).
What does Netdata report?
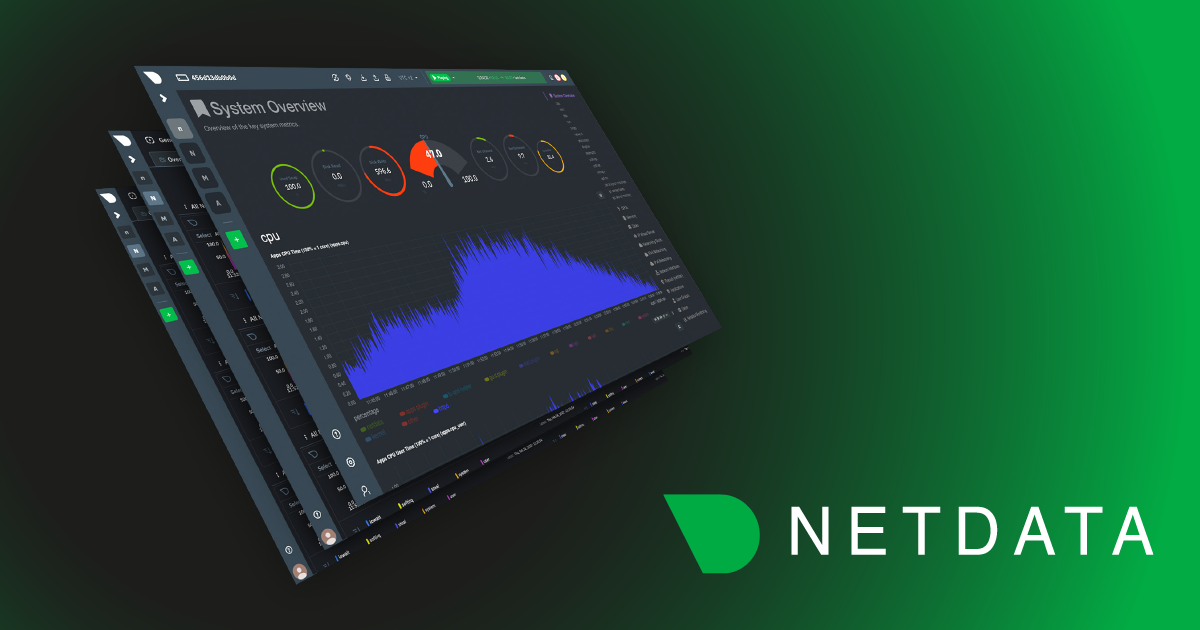
The total CPU utilization of the system:

Figure 1: The system overview section at Netdata, just a few seconds after the command was run
And at the applications apps.plugin breaks down CPU usage per application:

Figure 2: The Applications section at Netdata, just a few seconds after the command was run
So, the ssh session is using 95% CPU time.
Why ssh?
apps.plugin groups all processes based on its configuration file.
The default configuration has nothing for bash, but it has for sshd, so Netdata accumulates
all ssh sessions to a dimension on the charts, called ssh. This includes all the processes in
the process tree of sshd, including the exited children.
Distributions based on
systemd, provide another way to get cpu utilization per user session or service running: control groups, or cgroups, commonly used as part of containersapps.plugindoes not use these mechanisms. The process grouping made byapps.pluginworks on any Linux,systemdbased or not.


