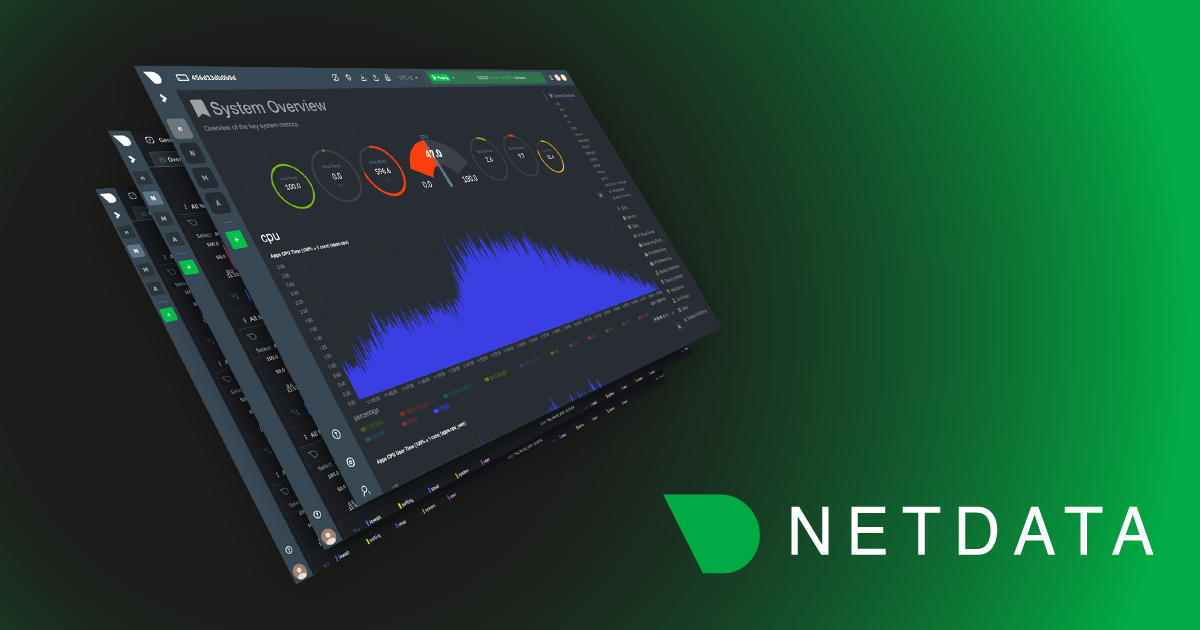
In Netdata’s first major release of 2020, we’re introducing two new features on the opposite ends of the monitoring spectrum.
On one hand, we’re releasing an eBPF collector, which lets you collect, monitor, and visualize incredibly precise metrics straight from the Linux kernel. On the other, we added the ability to label agents to help you organize entire infrastructures and see every important piece of information about streaming nodes in one place.
While disparate in scope and purpose, both of these features were inspired by our community, and will have enormous impact on the way people use Netdata to gather insights about their systems. In that sense, they are not opposites at all, but rather two more major steps in our effort to democratize monitoring and provide the best high-resolution monitoring tools through free and open-source (FOSS) software.
Beyond eBPF monitoring and host labels, this release comes with 3 new collectors, 53 bug fixes, 88 improvements, and 38 documentation updates. Let’s get into the details.
Give yourself a Linux ‘superpower’ with eBPF monitoring
With this release, we’re introducing the alpha version of our new eBPF collector. eBPF (extended Berkeley Packet Filter) is a virtual bytecode machine, built directly into the Linux kernel, that you can use for advanced monitoring and tracing.With this release, the eBPF collector monitors system calls inside your kernel to help you understand and visualize the behavior of your file descriptors, virtual file system (VFS) actions, and process/thread interactions. You can already use it for debugging applications and better understanding how the Linux kernel handles I/O and process management.

The eBPF collector is in a technical preview, and doesn’t come enabled out of the box. But, given that eBPF has been called a “superpower” for Linux observability, who wouldn’t want to give it a shot?
Right now, the eBPF collector can track open/closed file descriptors, VFS I/O and bytes read/written, process threads, and exited tasks. These can all be used for application monitoring, debugging, and better understanding how the Linux kernel handles the software you’ve written.
If you’d like to learn more about why eBPF metrics are such an important addition to Netdata, see our companion post: Linux eBPF monitoring with Netdata. When you’re ready to get started, enable the eBPF collector by following the steps in our documentation.
Organize entire infrastructures with host labels
This release also introduces host labels, a powerful new way of organizing your Netdata-monitored systems. Netdata automatically creates a handful of labels that group essential information, but you can supplement the defaults by segmenting your systems based on their location, purpose, operating system, or even when they went live.You can use host labels to create alarms that apply only to systems with specific labels, or apply labels to metrics you archive to other databases with our exporting engine. Because labels are streamed from slave to master systems, you can now find critical information about your entire infrastructure directly from the master system.
Our host labels tutorial will walk you through creating your first host labels and putting them to use in Netdata’s other features.
Dogfooding CockroachDB metrics collection
Because we use CockroachDB internally, we wanted a better way of keeping tabs on the health and performance of our databases using our own monitoring product. CockroachDB by Cockroach Labs, is a cloud-native database for distributed SQL, that’s designed for you to deploy your applications and services anywhere.Given how popular CockroachDB is right now, we know we’re not alone, and are excited to share this collector with our community.

See our tutorial on monitoring CockroachDB metrics for set-up details.
What else?
While some of these changes have been live for weeks or months, this is a good opportunity to talk about improvements to our documentation.Most recently, we revamped our collectors documentation to simplify how users learn about metrics collection. You can now view a collectors quickstart to learn the process of enabling collectors and monitoring more applications and services with Netdata, and see everything Netdata collects in our supported collectors list.
In January, we overhauled installation documentation to provide more concise installation instructions for most users. We also split instructions into multiple files to help you find exactly the right process for your system.
Back in December 2019, we published a 10-part tutorial to guide new users through every essential facet Netdata’s features, and how they immediately get the most value from monitoring their systems. If you’re dipping your toes in to health monitoring and performance troubleshooting, there’s no better place to start.
Our collectors have seen some important changes in this release. We added a new squid access log collector that parses and visualizes requests, bandwidth, responses, and much more. Our apps.plugin collector has new and improved way of processing groups together, and our cgroups collector is better at LXC (Linux container) monitoring.
Special thanks go out to the following contributors: k0ste, DefauIt, gmeszaros, blaines, stevenh, lassebm, yasharne, candrews, Jiab77, amishmm, tnyeanderson, yasharne, schneiderl, lucasRolff, Ehekatl, wonsangki, candrews, kkoomen, vzDevelopment, hexchain, nabijaczleweli, and rex4539.
There’s a lot more in v1.20 than this blog post, so be sure to check out the release notes on GitHub for the full story.


