The only agent that thinks for itself

Autonomous Monitoring with self-learning AI built-in, operating independently across your entire stack.

Unlimited Metrics & Logs
Machine learning & MCP
5% CPU, 150MB RAM
3GB disk, >1 year retention
800+ integrations, zero config
Dashboards, alerts out of the box
> Discover Netdata Agents
Centralized metrics streaming and storage

Aggregate metrics from multiple agents into centralized Parent nodes for unified monitoring across your infrastructure.

Stream from unlimited agents
Long-term data retention
High availability clustering
Data replication & backup
Scalable architecture
Enterprise-grade security
> Learn about Parents
Fully managed cloud platform

Access your monitoring data from anywhere with our SaaS platform. No infrastructure to manage, automatic updates, and global availability.

Zero infrastructure management
99.9% uptime SLA
Global data centers
Automatic updates & patches
Enterprise SSO & RBAC
SOC2 & ISO certified
> Explore Netdata Cloud
Deploy Netdata Cloud in your infrastructure

Run the full Netdata Cloud platform on-premises for complete data sovereignty and compliance with your security policies.

Complete data sovereignty
Air-gapped deployment
Custom compliance controls
Private network integration
Dedicated support team
Kubernetes & Docker support
> Learn about Cloud On-Premises
Powerful, intuitive monitoring interface

Modern, responsive UI built for real-time troubleshooting with customizable dashboards and advanced visualization capabilities.

Real-time chart updates
Customizable dashboards
Dark & light themes
Advanced filtering & search
Responsive on all devices
Collaboration features
> Explore Netdata UI
Monitor on the go

Native iOS and Android apps bring full monitoring capabilities to your mobile device with real-time alerts and notifications.

iOS & Android apps
Push notifications
Touch-optimized interface
Offline data access
Biometric authentication
Widget support
> Download apps

Best energy efficiency

True real-time per-second

100% automated zero config

Centralized observability

Multi-year retention

High availability built-in

Zero maintenance

Always up-to-date

Enterprise security

Complete data control

Air-gap ready

Compliance certified

Millisecond responsiveness

Infinite zoom & pan

Works on any device

Native performance

Instant alerts

Monitor anywhere

80% Faster Incident Resolution
AI-powered troubleshooting from detection, to root cause and blast radius identification, to reporting.
True Real-Time and Simple, even at Scale
Linearly and infinitely scalable full-stack observability, that can be deployed even mid-crisis.
90% Cost Reduction, Full Fidelity
Instead of centralizing the data, Netdata distributes the code, eliminating pipelines and complexity.
Control Without Surrender
SOC 2 Type 2 certified with every metric kept on your infrastructure.
Integrations

800+ collectors and notification channels, auto-discovered and ready out of the box.

800+ data collectors
Auto-discovery & zero config
Cloud, infra, app protocols
Notifications out of the box
> Explore integrations
Real Results
46% Cost Reduction

Reduced monitoring costs by 46% while cutting staff overhead by 67%.

— Leonardo Antunez, Codyas

Zero Pipeline

No data shipping. No central storage costs. Query at the edge.

From Our Users
"Out-of-the-Box"

So many out-of-the-box features! I mostly don't have to develop anything.

— Simon Beginn, LANCOM Systems

No Query Language

Point-and-click troubleshooting. No PromQL, no LogQL, no learning curve.

Enterprise Ready
67% Less Staff, 46% Cost Cut

Enterprise efficiency without enterprise complexity—real ROI from day one.

— Leonardo Antunez, Codyas

SOC 2 Type 2 Certified

Zero data egress. Only metadata reaches the cloud. Your metrics stay on your infrastructure.

Full Coverage
800+ Collectors

Auto-discovered and configured. No manual setup required.

Any Notification Channel

Slack, PagerDuty, Teams, email, webhooks—all built-in.

Built for the People Who Get Paged
Because 3am alerts deserve instant answers, not hour-long hunts.
Every Industry Has Rules. We Master Them.
See how healthcare, finance, and government teams cut monitoring costs 90% while staying audit-ready.
Monitor Any Technology. Configure Nothing.
Install the agent. It already knows your stack.
From Our Users
"A Rare Unicorn"

Netdata gives more than you invest in it. A rare unicorn that obeys the Pareto rule.

— Eduard Porquet Mateu, TMB Barcelona

99% Downtime Reduction

Reduced website downtime by 99% and cloud bill by 30% using Netdata alerts.

— Falkland Islands Government

Real Savings
30% Cloud Cost Reduction

Optimized resource allocation based on Netdata alerts cut cloud spending by 30%.

— Falkland Islands Government

46% Cost Cut

Reduced monitoring staff by 67% while cutting operational costs by 46%.

— Codyas

Real Coverage
"Plugin for Everything"

Netdata has agent capacity or a plugin for everything, including Windows and Kubernetes.

— Eduard Porquet Mateu, TMB Barcelona

"Out-of-the-Box"

So many out-of-the-box features! I mostly don't have to develop anything.

— Simon Beginn, LANCOM Systems

Real Speed
Troubleshooting in 30 Seconds

From 2-3 minutes to 30 seconds—instant visibility into any node issue.

— Matthew Artist, Nodecraft

20% Downtime Reduction

20% less downtime and 40% budget optimization from out-of-the-box monitoring.

— Simon Beginn, LANCOM Systems

Pay per Node. Unlimited Everything Else.

One price per node. Unlimited metrics, logs, users, and retention. No per-GB surprises.

Free tier—forever
No metric limits or caps
Retention you control
Cancel anytime
> See pricing plans
What's Your Monitoring Really Costing You?

Most teams overpay by 40-60%. Let's find out why.

Expose hidden metric charges
Calculate tool consolidation
Customers report 30-67% savings
Results in under 60 seconds
> See what you're really paying
Your Infrastructure Is Unique. Let's Talk.

Because monitoring 10 nodes is different from monitoring 10,000.

On-prem & air-gapped deployment
Volume pricing & agreements
Architecture review for your scale
Compliance & security support
> Start a conversation
Monitoring That Sells Itself

Deploy in minutes. Impress clients in hours. Earn recurring revenue for years.

30-second live demos close deals
Zero config = zero support burden
Competitive margins & deal protection
Response in 48 hours
> Apply to partner
Per-Second Metrics at Homelab Prices

Same engine, same dashboards, same ML. Just priced for tinkerers.

Community: Free forever · 5 nodes · non-commercial
Homelab: $90/yr · unlimited nodes · fair usage
> Start monitoring your lab—free
$1,000 Per Referral. Unlimited Referrals.

Your colleagues get 10% off. You get 10% commission. Everyone wins.

10% of subscriptions, up to $1,000 each
Track earnings inside Netdata Cloud
PayPal/Venmo payouts in 3-4 weeks
No caps, no complexity
> Get your referral link
Cost Proof
40% Budget Optimization

"Netdata's significant positive impact" — LANCOM Systems

Calculate Your Savings

Compare vs Datadog, Grafana, Dynatrace

Savings Proof
46% Cost Reduction

"Cut costs by 46%, staff by 67%" — Codyas

30% Cloud Bill Savings

"Reduced cloud bill by 30%" — Falkland Islands Gov

Enterprise Proof
"Better Than Combined Alternatives"

"Better observability with Netdata than combining other tools." — TMB Barcelona

Real Engineers, <24h Response

DPA, SLAs, on-prem, volume pricing

Why Partners Win
Demo Live Infrastructure

One command, 30 seconds, real data—no sandbox needed

Zero Tickets, High Margins

Auto-config + per-node pricing = predictable profit

Homelab Ready
"Absolutely Incredible"

"We tested every monitoring system under the sun." — Benjamin Gabler, CEO Rocket.Net

76k+ GitHub Stars

3rd most starred monitoring project

Worth Recommending
Product That Delivers

Customers report 40-67% cost cuts, 99% downtime reduction

Zero Risk to Your Rep

Free tier lets them try before they buy

Never Fight Fires Alone

Docs, community, and expert help—pick your path to resolution.

Learn.netdata.cloud docs
Discord, Forums, GitHub
Premium support available
> Get answers now
60 Seconds to First Dashboard

One command to install. Zero config. 850+ integrations documented.

Linux, Windows, K8s, Docker
Auto-discovers your stack
> Read our documentation
See Netdata in Action

Watch real-time monitoring in action—demos, tutorials, and engineering deep dives.

Product demos and walkthroughs
Real infrastructure, not staged
> Start with the 3-minute tour
Level Up Your Monitoring
Real problems. Real solutions. 112+ guides from basic monitoring to AI observability.
76,000+ Engineers Strong
615+ contributors. 1.5M daily downloads. One mission: simplify observability.
Per-Second. 90% Cheaper. Data Stays Home.
Side-by-side comparisons: costs, real-time granularity, and data sovereignty for every major tool.

See why teams switch from Datadog, Prometheus, Grafana, and more.

> Browse all comparisons
Edge-Native Observability, Born Open Source
Per-second visibility, ML on every metric, and data that never leaves your infrastructure.
Founded in 2016
615+ contributors worldwide
Remote-first, engineering-driven
Open source first
> Read our story
Promises We Publish—and Prove
12 principles backed by open code, independent validation, and measurable outcomes.
Open source, peer-reviewed
Zero config, instant value
Data sovereignty by design
Aligned pricing, no surprises
> See all 12 principles
Edge-Native, AI-Ready, 100% Open
76k+ stars. Full ML, AI, and automation—GPLv3+, not premium add-ons.
76,000+ GitHub stars
GPLv3+ licensed forever
ML on every metric, included
Zero vendor lock-in
> Explore our open source
Build Real-Time Observability for the World
Remote-first team shipping per-second monitoring with ML on every metric.
Remote-first, fully distributed
Open source (76k+ stars)
Challenging technical problems
Your code on millions of systems
> See open roles
Talk to a Netdata Human in <24 Hours
Sales, partnerships, press, or professional services—real engineers, fast answers.
Discuss your observability needs
Pricing and volume discounts
Partnership opportunities
Media and press inquiries
> Book a conversation
Your Data. Your Rules.
On-prem data, cloud control plane, transparent terms.
Trust & Scale
76,000+ GitHub Stars

One of the most popular open-source monitoring projects

SOC 2 Type 2 Certified

Enterprise-grade security and compliance

Data Sovereignty

Your metrics stay on your infrastructure

Validated
University of Amsterdam

"Most energy-efficient monitoring solution" — ICSOC 2023, peer-reviewed

ADASTEC (Autonomous Driving)

"Doesn't miss alerts—mission-critical trust for safety software"

Community Stats
615+ Contributors

Global community improving monitoring for everyone

1.5M+ Downloads/Day

Trusted by teams worldwide

GPLv3+ Licensed

Free forever, fully open source agent

Why Join?
Remote-First

Work from anywhere, async-friendly culture

Impact at Scale

Your work helps millions of systems

Compliance
SOC 2 Type 2

Audited security controls

GDPR Ready

Data stays on your infrastructure

Blog

How to find out which application is causing server load

Identifying Resource Hogs for Better System Performance
by Shyam Sreevalsan · October 26, 2022

We often hear the term load used to describe the state of a server or a device, but we’re here to tell you what it means, precisely, and how to monitor it.

What is server load?

We often hear the term “load” used to describe the state of a server or a device. But what does it really mean?

System load is a measure of the amount of computational work that a system performs. An overloaded system, by definition, isn’t able to complete all its tasks per schedule - this affects the performance and productivity of the system. And while “load” often gets conflated with CPU usage there’s a lot more to it.

Technically the term “load” refers to the number of processes waiting in queue to be processed and “load average” is represented as three separate averages over the previous 1 minute, 5 minutes and 15 minutes. The lower the load the better your server performance. Several factors can lead to high “load” - the usual culprits are CPU consumption, disk I/O and memory (more specifically swapping triggered by low available memory).

How to check the current server load?

If you are using Linux (or other Unix based OS) you can check what the server load is by executing the “w” command (or the “uptime” command) which generates output in the following format:

 11:37:09 up  1:07,  0 users,  load average: 0.29, 0.17, 0.11

We’re interested in the last entry, which gives the three load averages over the previous 1 minute, 5 minutes, and 15 minutes. Load averages can change and fluctuate significantly which is why the three load averages is useful.

The load average numbers should be interpreted as percentages, considering the number of cores in the system.

For example, in the above example the 1 minute load average is 0.29 - if this was a single core system then this equates to a 1 minute load average of 29%. If however this was a quad core system then this would equate to a 1 minute load average of only 7.25% (29/4). How do you check which application is causing load?

OK - so now you know if your system is loaded and what the load averages are. But what is causing the high load? Which application or process is the culprit?

htop is a great command (available by default on many Linux distros) to check which application(s) or process(es) could be causing high load. The output of this command looks something like this and gives you a quick idea of the CPU and Memory consumed by each process.

Server load 1

To understand disk io usage per process, you can use the following command

pidstat -dl
Linux 5.15.68.1-microsoft-standard-WSL2 (SHM-PC)        10/18/22        _x86_64_        (8 CPU)
12:12:54      UID       PID   kB_rd/s   kB_wr/s kB_ccwr/s iodelay  Command
12:12:54      112       213      0.02      0.00      0.00       0  /usr/sbin/netdata --special-spawn-server
12:12:54      112       464      0.13      0.00      0.00       0  bash /usr/libexec/netdata/plugins.d/tc-qos-helper.sh 1
  • kB_rd/s: Number of kilobytes the task has caused to be read from disk per second.
  • kB_wr/s: Number of kilobytes the task has caused, or shall cause to be written to disk per second.
  • kB_ccwr/s: Number of kilobytes whose writing to disk has been canceled by the task. This may occur when the task truncates some dirty pagecache. In this case, some IO which another task has been accounted for will not be happening.

How to monitor your server load?

Checking the value of a metric and monitoring that metric are two completely different things.

While the commands we talked about are very useful they are not built for 24x7 monitoring or for going back in time to the root cause of an issue.

To comprehensively monitor system load and all the details on which applications could be causing this load you need to use a monitoring solution like Netdata that allows you to constantly monitor the load, configure alerts if the load exceeds a certain threshold, go back in time to analyze time periods of interest and much more. Netdata automatically monitors server load so no extra configuration is needed.

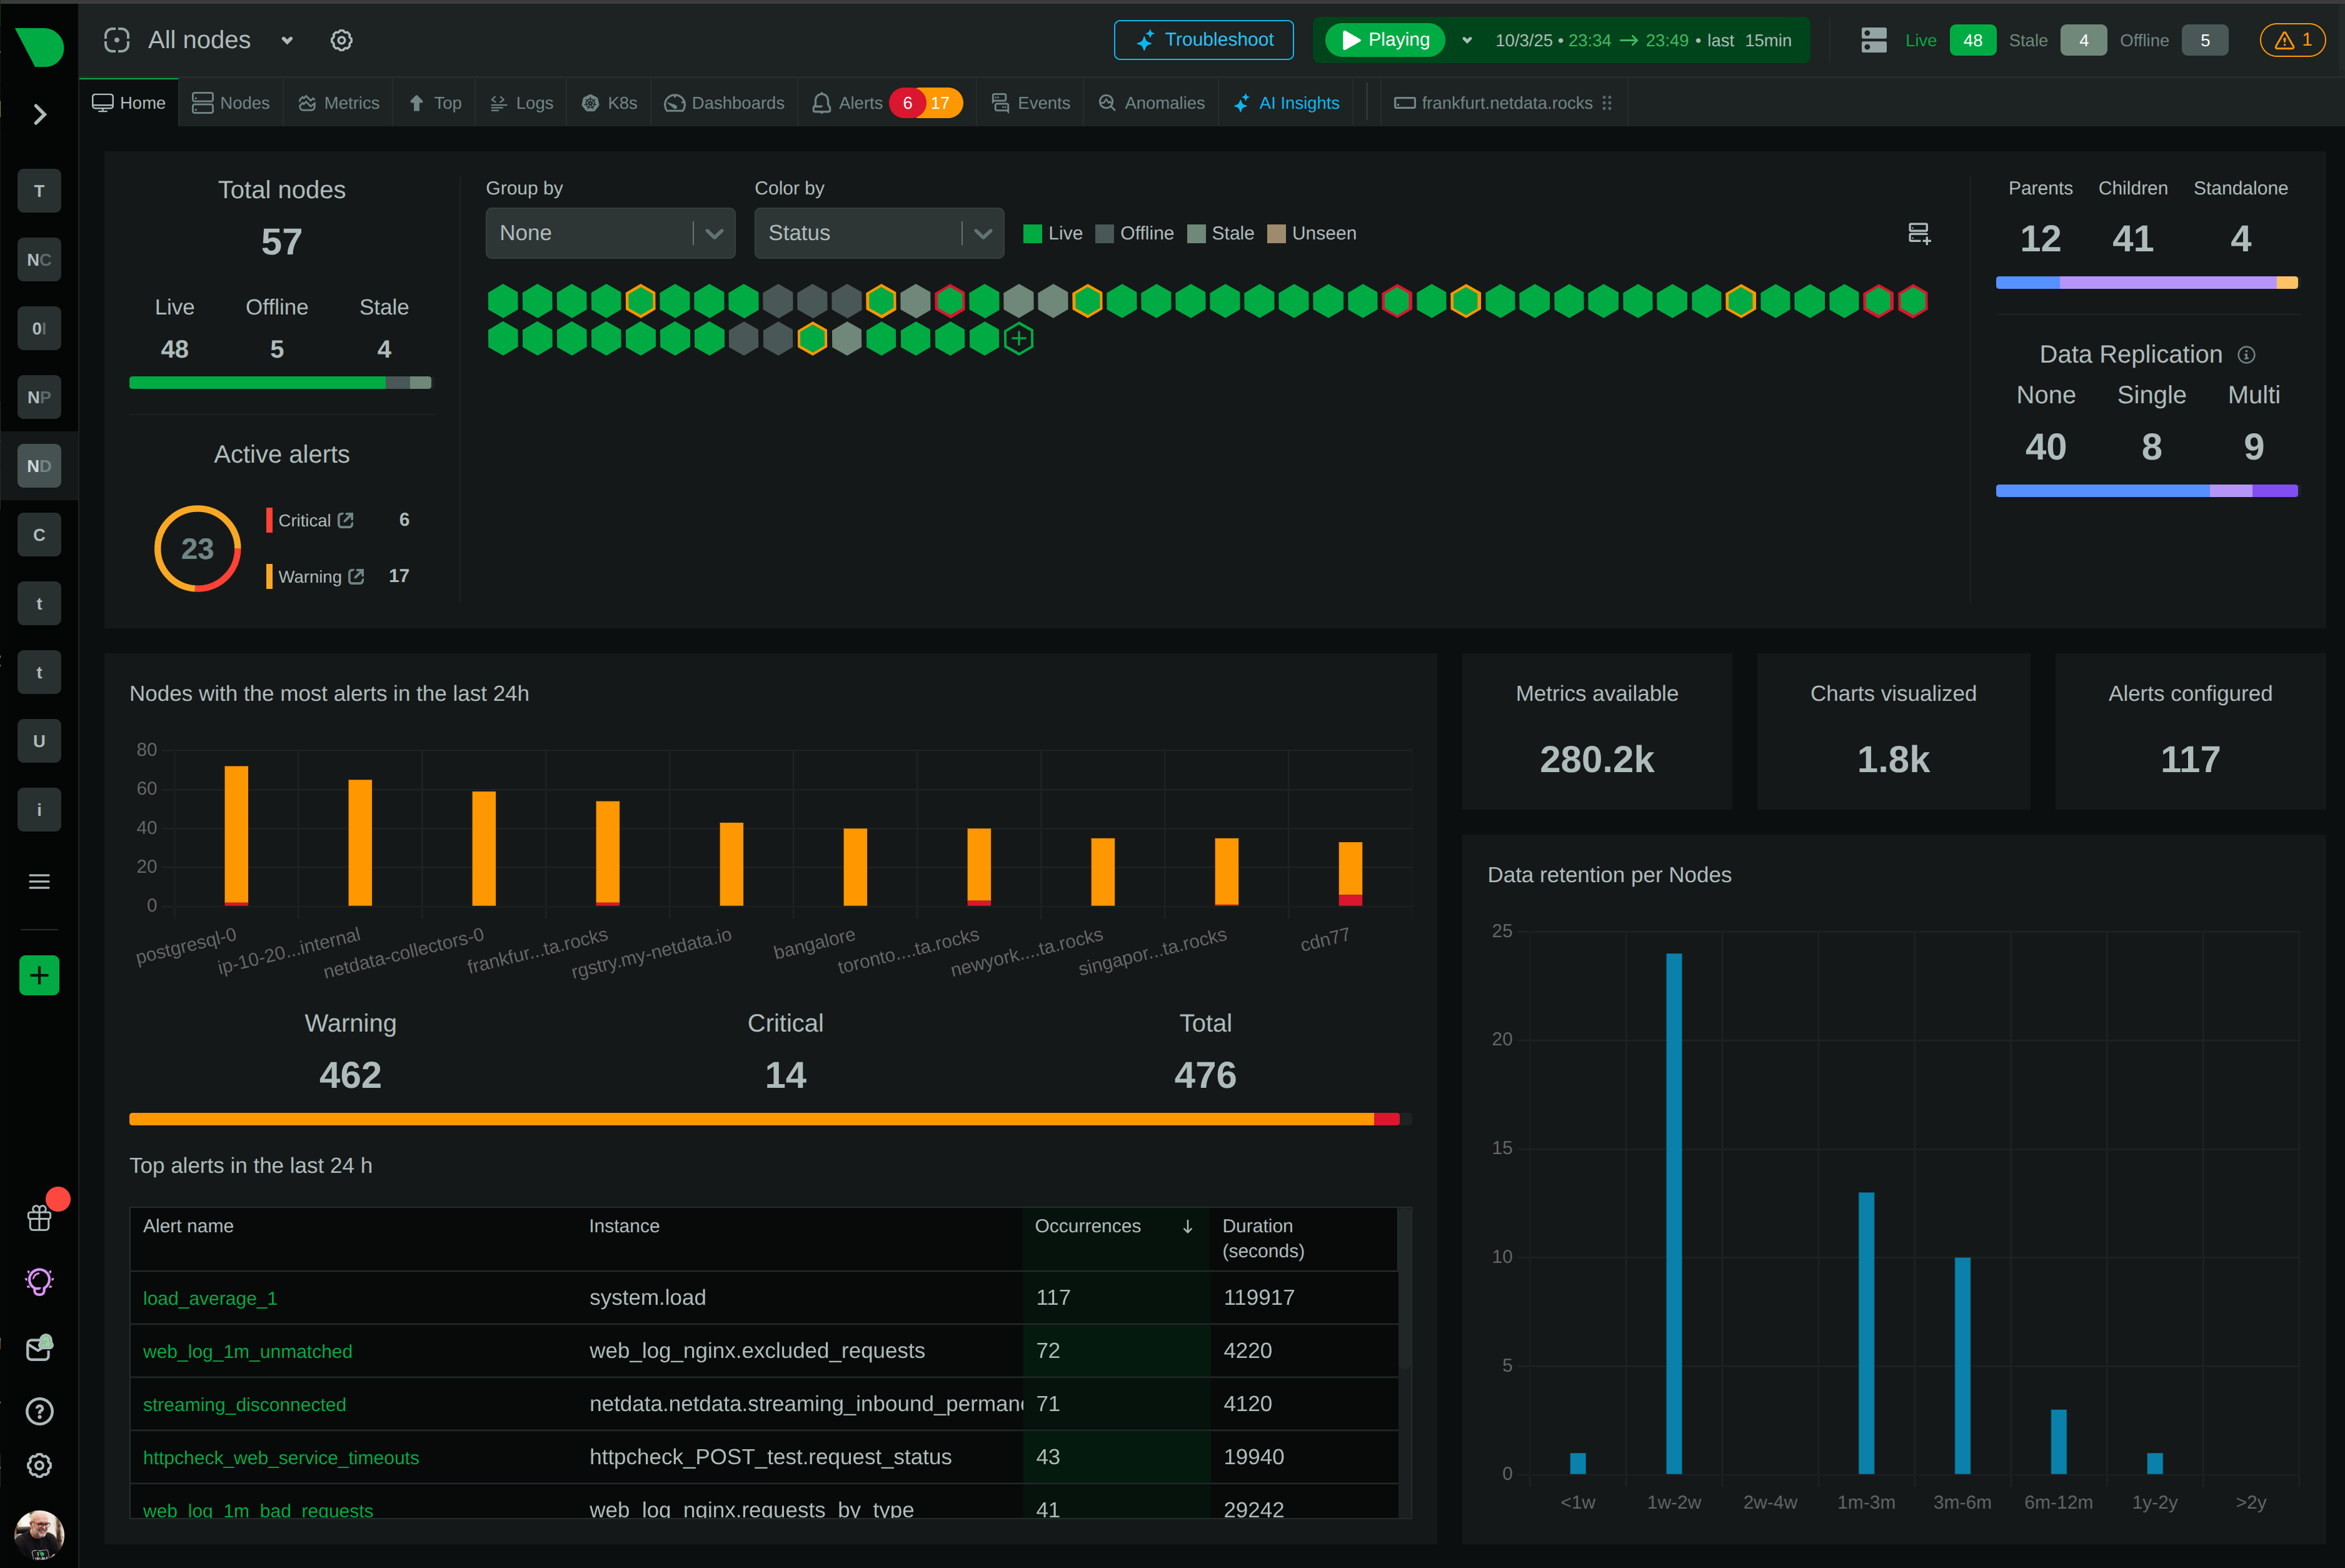
The load chart shown below is present in the System Overview section and shows the three load averages as a timeseries.

Server load 2

If the load averages exceed pre-thresholds then automated alerts are triggered - you can of course modify the thresholds per your use-case.

Server load 3 - load average

The applications section contains charts for CPU, Disk, Memory and much more at process group level so you know what could be causing the load at the time period you are interested in

Server load 4

Real world load test

Now for some fun. Let’s create some load and figure out which application caused it.

Here’s the load creator bash script that we’ll be using to trigger different types of loads periodically.

And we’ll use Netdata to:

  • Detect if the load is high
  • Measure the load averages
  • Investigate which application is causing the load

Netdata automatically detects hundreds of custom applications automatically, and you can add your own app so that the name of your application shows up in the charts and doesn’t get clubbed under “other”. The way to do this is by editing the /etc/netdata/apps_groups.conf and adding the following line.

LoadCreator: load_creator.sh

The first field is the name that shows up on the chart in the Netdata UI, the second field is the name of the script (wildcards work too in case you want to club multiple processes under one application name).

Here’s a quick video walkthrough of how to use Netdata for load monitoring and identifying which application is causing load.

To see this in action in an interactive environment, check out the Netdata Demo Space.

Let us hear from you

If you haven’t already, sign up now for a free Netdata account!!

We’d love to hear from you – if you have any questions, complaints, or feedback, reach out to us on Discord or Github.. Happy Troubleshooting!