Interrupts, softirqs, and softnet are all critical parts of the Linux kernel that can impact system performance. In this blog post, we’ll explore their usefulness, and discuss how to monitor them using Netdata for both bare-metal servers and VMs.
What are Interrupts?
Interrupts are signals generated by hardware devices to indicate that they require attention from the CPU. Hardware devices can generate interrupts for a variety of reasons, including data transmission or reception, input/output operations, and other activities. When an interrupt is generated, the CPU stops what it is doing and handles the interrupt. Interrupts can have a significant impact on system performance, especially if there are a high number of interrupts occurring.
Although most interrupts are associated with specific devices, there are a few interrupts that are available on most systems:
-
LOC (Local Timer Interrupt): This interrupt is generated by the local timer on each CPU core. The local timer is used by the kernel for scheduling purposes and to track time elapsed since system boot.
-
IWI (Wireless Interrupt): This interrupt is generated by wireless network interface cards (NICs) when they receive or transmit data.
-
RES (Rescheduling Interrupt): This interrupt is generated by the kernel when it needs to reschedule a process or thread to run on a different CPU core.
-
CAL (Function Call Interrupt): This interrupt is generated by the kernel when it needs to call a specific function or service.
-
TLB (Translation Lookaside Buffer Interrupt): This interrupt is generated by the CPU when it needs to perform a translation lookup for virtual memory addresses.
-
MCP (Machine Check Exception): This interrupt is generated by the CPU or other hardware devices when they detect a hardware error or fault.
Interrupts on Cloud VMs
In cloud environments, virtual machines (VMs) are typically running on a physical host system that is managed by the cloud provider. When a hardware device generates an interrupt, it is sent to the physical host system. The host system then forwards the interrupt to the appropriate virtual machine. The virtual machine then handles the interrupt as if it were running on physical hardware.
So, when you are monitoring interrupts in a virtual machine, you are actually monitoring the hardware interrupts that are generated by the physical host system and forwarded to the virtual machine. This means that the number of interrupts you see in the virtual machine may be lower than the actual number of interrupts generated by the hardware, since some interrupts may be handled by the host system before they are forwarded to the virtual machine.
However, the way interrupts are handled in virtual machines can be different than in physical machines, since the virtualization layer can introduce additional overhead and complexity. Additionally, the way that hardware devices are emulated or passed through to virtual machines can impact interrupt handling and performance.
It’s also worth noting that some cloud providers may limit the number of interrupts that are forwarded to virtual machines, in order to prevent noisy neighbors from impacting the performance of other VMs running on the same host system. This can impact the accuracy of interrupt monitoring in virtual machines.
What are Softirqs?
Softirqs (software interrupt requests) are similar to interrupts, but they are generated by the kernel itself rather than hardware devices. Softirqs are used for a variety of purposes, such as network processing, task scheduling, and disk I/O. Softirqs are generally less time-critical than hardware interrupts, but they can still impact system performance.
Here is a list of the possible softirqs:
-
TIMER: This
softirqis used for timer management, such as scheduling periodic tasks or triggering events after a certain amount of time has elapsed. -
NET_TX: This
softirqis used for network packet transmission, such as sending data over a network interface card. -
NET_RX: This
softirqis used for network packet reception, such as processing incoming data from a network interface card. -
TASKLET: This
softirqis used for task scheduling, such as scheduling work to be done in response to an event or interrupt. -
SCHED: This
softirqis used for task scheduling as well, but it is used for higher-priority scheduling activities. -
HRTIMER: This
softirqis used for high-resolution timer management, such as scheduling tasks with precise timing requirements. -
RCU (Read-Copy Update): This
softirqis used for synchronization between multiple threads or processes that access shared data. It ensures that shared data is not modified by one thread while another thread is reading it. -
BLOCK: This
softirqis used for block device I/O operations, such as reading from or writing to a hard disk. -
IRQ_POLL: This
softirqis used to poll hardware devices for new data, rather than waiting for an interrupt. -
IRQ_THREADED: This
softirqis used for threaded interrupt handling, which allows interrupt handling to be offloaded to a separate thread rather than being handled directly by the kernel. -
SCHEDSTAT: This
softirqis used for collecting scheduling statistics, such as the number of processes in each scheduling class. -
SLOWPATH: This
softirqis used for slow-path packet processing, such as handling packets that require additional processing or validation.
What is Softnet?
Softnet is a specific type of softirq that is used for network processing. Softnet is responsible for handling incoming network packets and routing them to the appropriate processes or applications. Like other softirqs, softnet can impact system performance, especially if there is a high volume of network traffic.
These are the dimensions provided by Netdata:
-
Processed: This dimension shows the number of packets that were successfully processed by the softnet code. When a packet is received by the network interface, it is passed to the softnet code for processing. The softnet code performs a variety of tasks, such as protocol decoding, packet filtering, and routing. The number of packets processed can indicate how much traffic your network is handling and whether your system is keeping up with the workload.
-
Dropped: This dimension shows the number of packets that were dropped because the network device backlog was full. When the network interface receives a large volume of packets, it may not be able to keep up with the workload. In this case, the backlog can become full, and packets may be dropped to prevent the backlog from overflowing. If you are seeing a high number of dropped packets, it may indicate that your network interface is overwhelmed and needs to be optimized.
-
Squeezed: This dimension shows the number of times the network device budget was consumed or the time limit was reached, but more work was available. The network device budget is a resource that is allocated to the softnet code to process incoming packets. When the budget is consumed or the time limit is reached, the softnet code may not be able to process all of the available packets. In this case, the softnet code will “squeeze” the remaining packets into the next budget or time slice. If you are seeing a high number of squeezed packets, it may indicate that your network interface is not keeping up with the workload and needs to be optimized.
-
ReceivedRPS: This dimension shows the number of times this CPU has been woken up to process packets via an Inter-processor Interrupt (IPI). When a packet is received by the network interface, it may be handled by a different CPU than the one that is running the softnet code. In this case, an IPI is used to wake up the CPU that is running the softnet code to process the packet. If you are seeing a high number of received RPS events, it may indicate that the softnet processing is being spread across multiple CPUs, which can improve performance.
-
FlowLimitCount: This dimension shows the number of times the flow limit has been reached (flow limiting is an optional Receive Packet Steering feature). Flow limiting is a mechanism that is used to distribute incoming packets across multiple CPUs in a balanced manner. When the flow limit is reached, the softnet code may not be able to distribute packets evenly across all CPUs. If you are seeing a high number of flow limit events, it may indicate that the softnet code is not able to distribute packets evenly across all CPUs, which can impact performance.
Why Monitor Interrupts, Softirqs, and Softnet?
Monitoring interrupts, softirqs, and softnet can help you identify performance issues and troubleshoot problems in cloud VMs. By monitoring these metrics, you can identify potential issues related to hardware devices, software performance, and network traffic. This can help you take proactive steps to optimize system performance and avoid issues that could impact your VMs.
How to Monitor Interrupts, Softirqs, and Softnet with Netdata?
Netdata is a powerful real-time performance monitoring tool that can provide insights into system performance, including interrupts, softirqs, and softnet. Netdata can collect and display metrics on a wide variety of system resources, including CPU usage, memory usage, network traffic, and disk I/O, and many more.
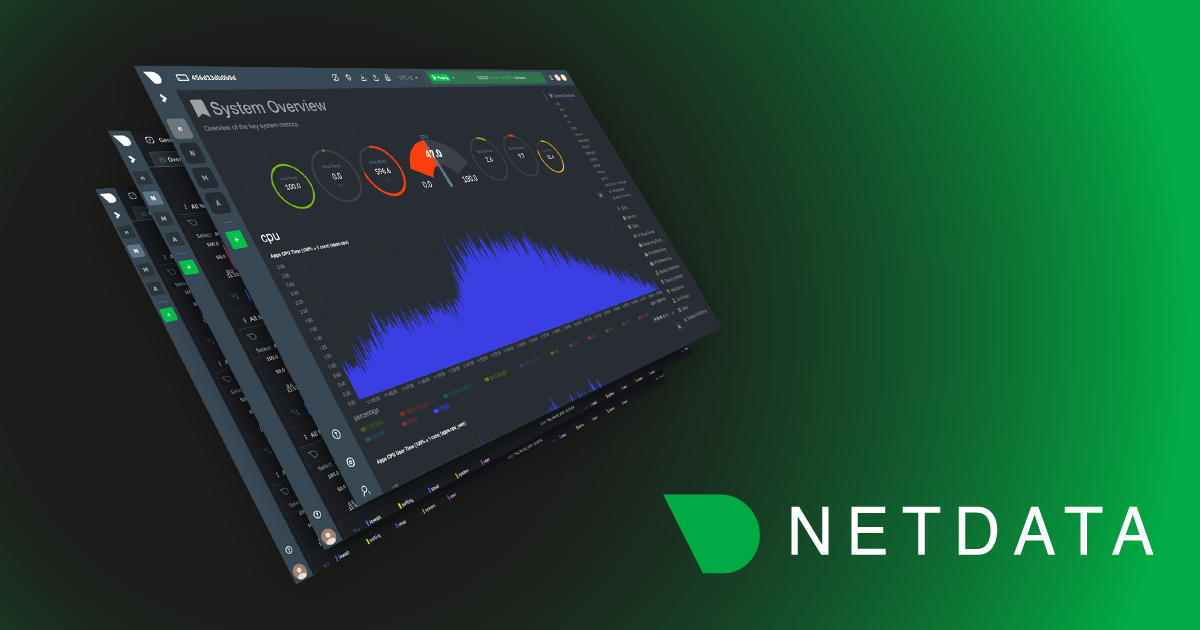
To monitor interrupts, softirqs, and softnet in Netdata for cloud VMs, you can navigate to the System Overview dashboard and look for the relevant charts. These charts can show you the current values for these metrics, as well as historical trends over time.
By monitoring interrupts, softirqs, and softnet per core at the CPUs section, you can identify which CPU cores are experiencing the highest levels of activity.


