The Importance Of Monitoring Web Servers
Web servers are among the most important components in modern IT infrastructures. They host the websites, web services, and web applications that we use on a daily basis. Social networking, media streaming, software as a service (SaaS), and other activities wouldn’t be possible without the use of web servers. And with the advent of cloud computing and the movement of more services online, web servers and their monitoring are only becoming more important. Given the extensive usage of Web servers, Sysadmins and SREs should monitor web servers as a key aspect for performance.
How Web Server Monitoring Works - Step-by-Step With Netdata
Web server monitoring involves continuously tracking various performance and health metrics to ensure the web server operates optimally. Netdata offers real-time, high-resolution monitoring that automates the entire process, ensuring you have full visibility into your infrastructure.
Setup & Configuration
- Choosing Netdata: Netdata’s monitoring platform provides a comprehensive solution tailored to meet diverse server monitoring needs.
- Installation: Easily install Netdata’s lightweight agent on your web server to start monitoring within minutes.
- Configuration: Customize the platform to monitor critical metrics, set performance thresholds, and configure instant alerts to suit your specific requirements.
Data Collection
- Metrics Gathering: Netdata continuously collects detailed data on key performance indicators such as CPU and memory usage, disk space, network traffic, and response times, providing high-resolution metrics without adding significant load to your server.
- Logs Analysis: Analyze server logs to detect errors, unusual activity, or potential security threats, all in real-time, using Netdata’s built-in capabilities.
Data Transmission
The collected metrics are stored on-premise on your own servers and are ephemerally transmitted securely to your browser window through Netdata only when you are viewing the dashboard for centralized real-time visualization. This enables real-time insights and efficient data storage for historical analysis.
Analysis & Visualization
- Real-Time Monitoring: Netdata processes the collected data in real-time, allowing you to detect anomalies and potential issues instantly.
- Dashboards & Reports: Netdata offers rich, customizable dashboards that visualize your server’s performance data, making it easier to monitor and manage server health. Detailed reports are available for historical trends and performance optimization.
Alerting & Notifications
- Thresholds: Define custom thresholds for various performance metrics, such as setting CPU usage limits at 85% or higher.
- Alerts: When a threshold is breached, Netdata generates alerts to notify administrators of potential problems.
- Multi-Channel Notifications: Receive alerts via email, SMS, Slack, or other integrated communication tools, ensuring you’re instantly informed of critical server issues.
Response & Resolution
- Incident Response: Upon receiving an alert, administrators can use Netdata’s platform to quickly diagnose the issue, whether it requires restarting services, increasing resources, or troubleshooting application code.
- Automation: Netdata supports automated responses to specific conditions, allowing you to scale server resources, restart services, or execute custom scripts without manual intervention.
Types Of Monitoring
Uptime Monitoring
Netdata continuously checks if your server is online and accessible by sending HTTP requests at regular intervals. This helps ensure that any downtime is detected immediately.
Performance Monitoring
Netdata tracks key metrics like response times, CPU usage, memory usage, and disk I/O in real-time, allowing you to optimize your server’s performance.
Application Monitoring
Monitor the performance of applications running on your server with Netdata’s application-level monitoring. Track database queries, user transactions, and application errors to ensure smooth operation.
Resource Monitoring
Netdata provides detailed insights into resource utilization, including CPU, memory, disk space, and network bandwidth, enabling you to make informed decisions about scaling and resource allocation.
Crucial Metrics To Monitor On Web Servers
There are dozens of web servers, but the two most popular are Apache and NGINX. And irrespective of the web server in use, apart from the host metrics on which the web server is hosted like - Uptime, CPU Usage, Memory Usage, Cache, Threads etc - you will need to monitor metrics related to the Web server connections themselves and some of the more important ones are:
Request Rate
The number of requests that the server receives over time. High request rates could indicate a recent increase in traffic.
Response Rate/Error Codes
The number of requests that the server is able to handle and respond over time and to monitor any errors in response.
Response Time
The time to send a response to a request. High response times could indicate problems with the web server, host, or website resources, and result in frustrated users.
Response Size/Bandwidth
The amount of data delivered with each response (typically measured in bytes). Smaller responses use less network bandwidth and load faster for users, especially over limited and mobile connections.
Active Connections
The number of requests currently being fulfilled. Too many active connections can exhaust the host’s available network ports, preventing new users from connecting.
Using Netdata’s Web Server Log Collector
Both Apache and NGINX report internal metrics via an HTML page. Apache has the mod_status module, and NGINX has the ngx_http_stub_status_module module. The Netdata plugins for NGINX Monitoring and Apache Monitoring generate metrics and alerts from these pages. But if you can provide Netdata access to their log files, you can get even more insights via the generic Web Server Log Monitoring collector.
Once the collector is set up, it comes with default summary charts (which can be modified on the custom dashboards in the future) and gives a high level indication of how the web server(s) are performing.
Request Rate: Now, going into the individual metrics let us look at the most important ones and the rate of “requests” being handled by the Web servers determines the load and an indication of whether sufficient computing resources are allocated to the service if the cpu, memory, etc. are showing signs of exhaustion.
If you are monitoring multiple Web servers, you can further group by “instance” to see the requests being handled by each of your web servers. Now, the dimension names look funny. That’s because our front-end does some funky things to keep the length of each dimension within a certain width. When you hover over the chart, you see the fully expanded dimension names.
Response rate / Error Codes: The next important metric to monitor is the “response” rate to compare if the request and response rates are in order. And in addition the error codes on responses will provide a good idea of any issues in serving the requests.
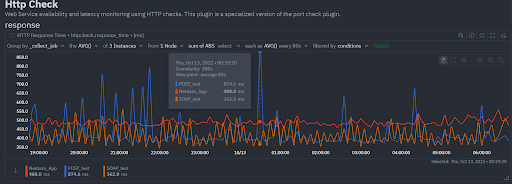
Response time and Response size: In addition, monitoring the “request processing time” (response time) and “bandwidth” (response size) gives a realistic view of the web server’s capability of serving multiple requests and can point to any latencies on specific web server instances.
Type of Requests: In the world of web servers, it is also crucial to understand the types of requests and clients to allocate the necessary resources/networking.
The Web server log collector also comes with default alerts which can be further customized to your infrastructure’s requirements. You can view all the active alerts and configured alerts on the Alerts tab.
For more information on configuring the Web server log Collector using Netdata and setting up custom alerts look into the enclosed links.
Let Us Hear From You
If you haven’t already, sign up now for a free Netdata account!
We’d love to hear from you – if you have any questions, complaints or feedback please reach out to us on Discord or Github.
Happy Troubleshooting!


