System statistics
Plugin: proc.plugin
Module: /proc/stat
Overview
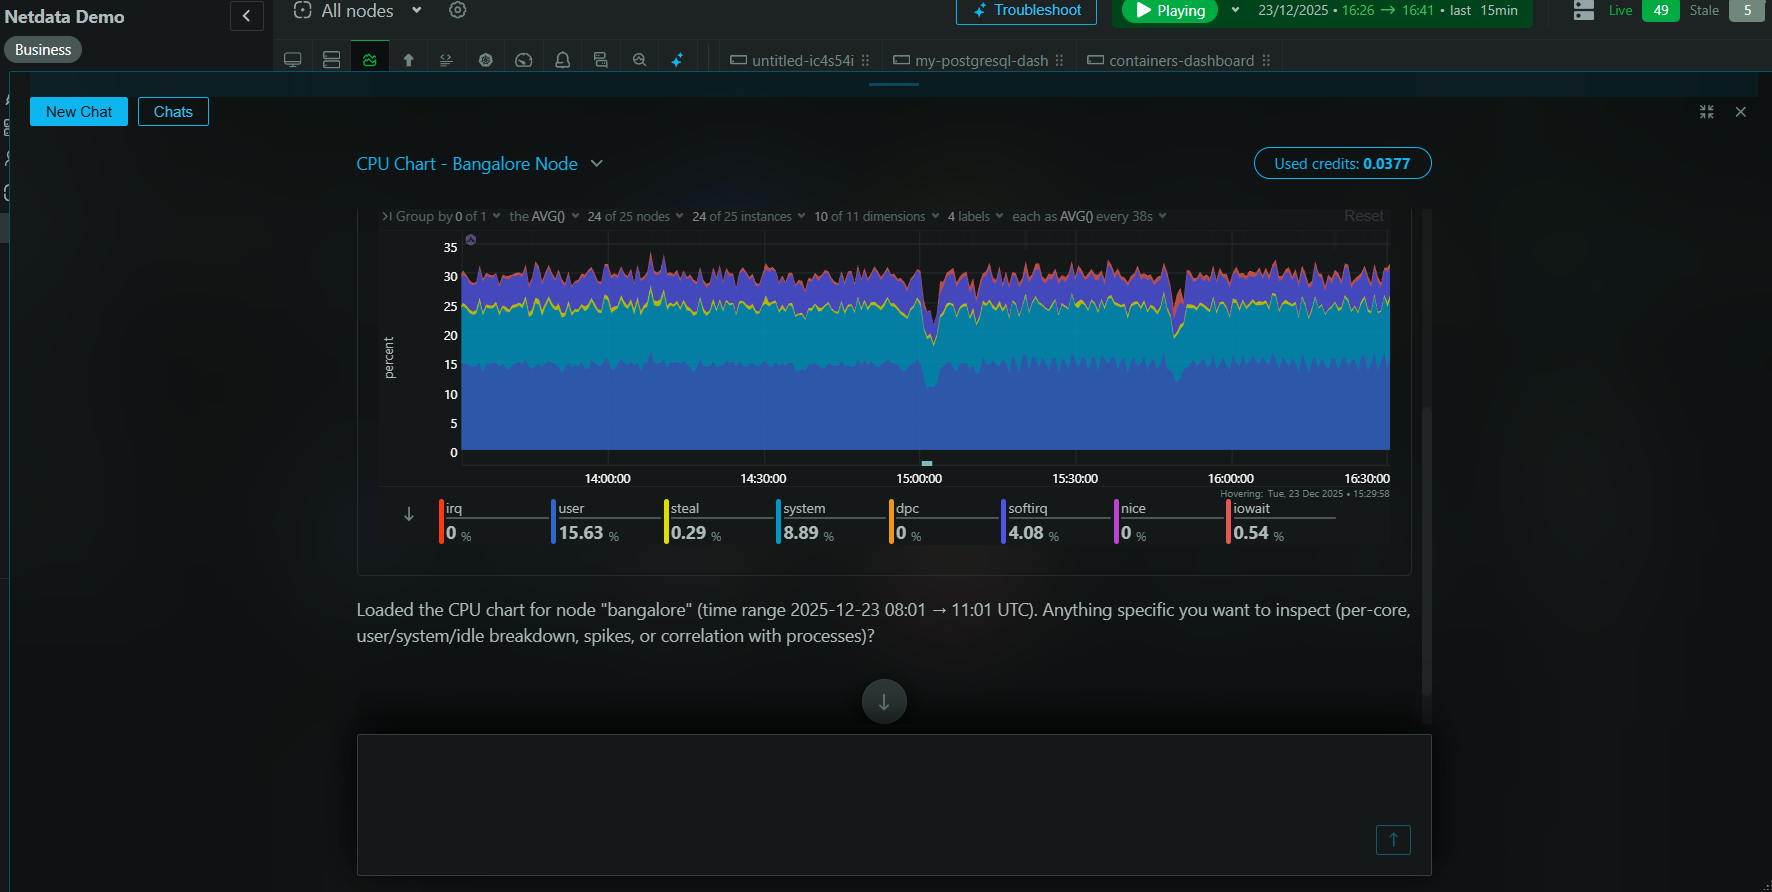
CPU utilization, states and frequencies and key Linux system performance metrics.
The /proc/stat file provides various types of system statistics:
- The overall system CPU usage statistics
- Per CPU core statistics
- The total context switching of the system
- The total number of processes running
- The total CPU interrupts
- The total CPU softirqs
The collector also reads:
/proc/schedstat for statistics about the process scheduler in the Linux kernel./sys/devices/system/cpu/[X]/thermal_throttle/core_throttle_count to get the count of thermal throttling events for a specific CPU core on Linux systems./sys/devices/system/cpu/[X]/thermal_throttle/package_throttle_count to get the count of thermal throttling events for a specific CPU package on a Linux system./sys/devices/system/cpu/[X]/cpufreq/scaling_cur_freq to get the current operating frequency of a specific CPU core./sys/devices/system/cpu/[X]/cpufreq/stats/time_in_state to get the amount of time the CPU has spent in each of its available frequency states./sys/devices/system/cpu/[X]/cpuidle/state[X]/name to get the names of the idle states for each CPU core in a Linux system./sys/devices/system/cpu/[X]/cpuidle/state[X]/time to get the total time each specific CPU core has spent in each idle state since the system was started.
This collector is only supported on the following platforms:
This collector only supports collecting metrics from a single instance of this integration.
Default Behavior
Auto-Detection
The collector auto-detects all metrics. No configuration is needed.
Limits
The default configuration for this integration does not impose any limits on data collection.
The collector disables cpu frequency and idle state monitoring when there are more than 128 CPU cores available.
Setup
Prerequisites
No action required.
Configuration
Options
| Option | Description | Default | Required |
|---|
| per cpu core utilization | Collects CPU usage metrics for each individual core, in addition to the system-wide averages. | no | no |
| cpu idle states | Collects CPU idle state residency metrics for each individual core, showing how much time each core spends in different idle states (C-states). | no | no |
via File
The configuration file name for this integration is netdata.conf.
Configuration for this specific integration is located in the plugin:proc:/proc/stat section within that file.
The file format is a modified INI syntax. The general structure is:
[section1]
    option1 = some value
    option2 = some other value

[section2]
    option3 = some third value
You can edit the configuration file using the edit-config script from the
Netdata config directory.
cd /etc/netdata 2>/dev/null || cd /opt/netdata/etc/netdata
sudo ./edit-config netdata.conf
Examples
There are no configuration examples.
Metrics
Metrics grouped by scope.
The scope defines the instance that the metric belongs to. An instance is uniquely identified by a set of labels.
Per System statistics instance
This scope has no labels.
Metrics:
| Metric | Dimensions | Unit |
|---|
| system.cpu | guest_nice, guest, steal, softirq, irq, user, system, nice, iowait, idle | percentage |
| system.intr | interrupts | interrupts/s |
| system.ctxt | switches | context switches/s |
| system.forks | started | processes/s |
| system.processes | running, blocked | processes |
| cpu.core_throttling | a dimension per cpu core | events/s |
| cpu.package_throttling | a dimension per package | events/s |
| cpu.cpufreq | a dimension per cpu core | MHz |
Per cpu core
Per-core CPU metrics. Disabled by default, can be enabled in the configuration options.
Labels:
| Label | Description |
|---|
| cpu | Identifier of the CPU core (e.g., core0, core1, core2). |
Metrics:
| Metric | Dimensions | Unit |
|---|
| cpu.cpu | guest_nice, guest, steal, softirq, irq, user, system, nice, iowait, idle | percentage |
| cpuidle.cpu_cstate_residency_time | a dimension per c-state | percentage |
Alerts
The following alerts are available:
| Alert name | On metric | Description |
|---|
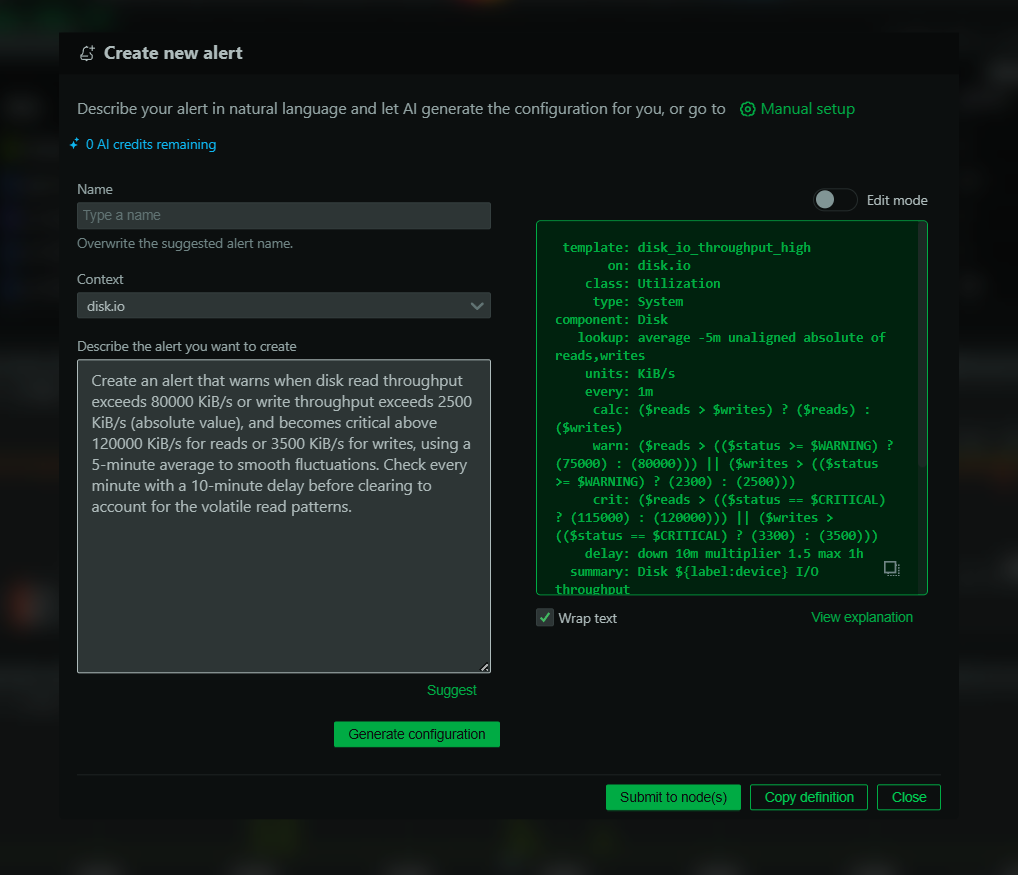
| 10min_cpu_usage | system.cpu | average CPU utilization over the last 10 minutes (excluding iowait, nice and steal) |
| 10min_cpu_iowait | system.cpu | average CPU iowait time over the last 10 minutes |
| 20min_steal_cpu | system.cpu | average CPU steal time over the last 20 minutes |


