The only agent that thinks for itself

Autonomous Monitoring with self-learning AI built-in, operating independently across your entire stack.

Unlimited Metrics & Logs
Machine learning & MCP
5% CPU, 150MB RAM
3GB disk, >1 year retention
800+ integrations, zero config
Dashboards, alerts out of the box
> Discover Netdata Agents
Centralized metrics streaming and storage

Aggregate metrics from multiple agents into centralized Parent nodes for unified monitoring across your infrastructure.

Stream from unlimited agents
Long-term data retention
High availability clustering
Data replication & backup
Scalable architecture
Enterprise-grade security
> Learn about Parents
Fully managed cloud platform

Access your monitoring data from anywhere with our SaaS platform. No infrastructure to manage, automatic updates, and global availability.

Zero infrastructure management
99.9% uptime SLA
Global data centers
Automatic updates & patches
Enterprise SSO & RBAC
SOC2 & ISO certified
> Explore Netdata Cloud
Deploy Netdata Cloud in your infrastructure

Run the full Netdata Cloud platform on-premises for complete data sovereignty and compliance with your security policies.

Complete data sovereignty
Air-gapped deployment
Custom compliance controls
Private network integration
Dedicated support team
Kubernetes & Docker support
> Learn about Cloud On-Premises
Powerful, intuitive monitoring interface

Modern, responsive UI built for real-time troubleshooting with customizable dashboards and advanced visualization capabilities.

Real-time chart updates
Customizable dashboards
Dark & light themes
Advanced filtering & search
Responsive on all devices
Collaboration features
> Explore Netdata UI
Monitor on the go

Native iOS and Android apps bring full monitoring capabilities to your mobile device with real-time alerts and notifications.

iOS & Android apps
Push notifications
Touch-optimized interface
Offline data access
Biometric authentication
Widget support
> Download apps

Best energy efficiency

True real-time per-second

100% automated zero config

Centralized observability

Multi-year retention

High availability built-in

Zero maintenance

Always up-to-date

Enterprise security

Complete data control

Air-gap ready

Compliance certified

Millisecond responsiveness

Infinite zoom & pan

Works on any device

Native performance

Instant alerts

Monitor anywhere

80% Faster Incident Resolution
AI-powered troubleshooting from detection, to root cause and blast radius identification, to reporting.
True Real-Time and Simple, even at Scale
Linearly and infinitely scalable full-stack observability, that can be deployed even mid-crisis.
90% Cost Reduction, Full Fidelity
Instead of centralizing the data, Netdata distributes the code, eliminating pipelines and complexity.
Control Without Surrender
SOC 2 Type 2 certified with every metric kept on your infrastructure.
Integrations

800+ collectors and notification channels, auto-discovered and ready out of the box.

800+ data collectors
Auto-discovery & zero config
Cloud, infra, app protocols
Notifications out of the box
> Explore integrations
Real Results
46% Cost Reduction

Reduced monitoring costs by 46% while cutting staff overhead by 67%.

— Leonardo Antunez, Codyas

Zero Pipeline

No data shipping. No central storage costs. Query at the edge.

From Our Users
"Out-of-the-Box"

So many out-of-the-box features! I mostly don't have to develop anything.

— Simon Beginn, LANCOM Systems

No Query Language

Point-and-click troubleshooting. No PromQL, no LogQL, no learning curve.

Enterprise Ready
67% Less Staff, 46% Cost Cut

Enterprise efficiency without enterprise complexity—real ROI from day one.

— Leonardo Antunez, Codyas

SOC 2 Type 2 Certified

Zero data egress. Only metadata reaches the cloud. Your metrics stay on your infrastructure.

Full Coverage
800+ Collectors

Auto-discovered and configured. No manual setup required.

Any Notification Channel

Slack, PagerDuty, Teams, email, webhooks—all built-in.

Built for the People Who Get Paged
Because 3am alerts deserve instant answers, not hour-long hunts.
Every Industry Has Rules. We Master Them.
See how healthcare, finance, and government teams cut monitoring costs 90% while staying audit-ready.
Monitor Any Technology. Configure Nothing.
Install the agent. It already knows your stack.
From Our Users
"A Rare Unicorn"

Netdata gives more than you invest in it. A rare unicorn that obeys the Pareto rule.

— Eduard Porquet Mateu, TMB Barcelona

99% Downtime Reduction

Reduced website downtime by 99% and cloud bill by 30% using Netdata alerts.

— Falkland Islands Government

Real Savings
30% Cloud Cost Reduction

Optimized resource allocation based on Netdata alerts cut cloud spending by 30%.

— Falkland Islands Government

46% Cost Cut

Reduced monitoring staff by 67% while cutting operational costs by 46%.

— Codyas

Real Coverage
"Plugin for Everything"

Netdata has agent capacity or a plugin for everything, including Windows and Kubernetes.

— Eduard Porquet Mateu, TMB Barcelona

"Out-of-the-Box"

So many out-of-the-box features! I mostly don't have to develop anything.

— Simon Beginn, LANCOM Systems

Real Speed
Troubleshooting in 30 Seconds

From 2-3 minutes to 30 seconds—instant visibility into any node issue.

— Matthew Artist, Nodecraft

20% Downtime Reduction

20% less downtime and 40% budget optimization from out-of-the-box monitoring.

— Simon Beginn, LANCOM Systems

Pay per Node. Unlimited Everything Else.

One price per node. Unlimited metrics, logs, users, and retention. No per-GB surprises.

Free tier—forever
No metric limits or caps
Retention you control
Cancel anytime
> See pricing plans
What's Your Monitoring Really Costing You?

Most teams overpay by 40-60%. Let's find out why.

Expose hidden metric charges
Calculate tool consolidation
Customers report 30-67% savings
Results in under 60 seconds
> See what you're really paying
Your Infrastructure Is Unique. Let's Talk.

Because monitoring 10 nodes is different from monitoring 10,000.

On-prem & air-gapped deployment
Volume pricing & agreements
Architecture review for your scale
Compliance & security support
> Start a conversation
Monitoring That Sells Itself

Deploy in minutes. Impress clients in hours. Earn recurring revenue for years.

30-second live demos close deals
Zero config = zero support burden
Competitive margins & deal protection
Response in 48 hours
> Apply to partner
Per-Second Metrics at Homelab Prices

Same engine, same dashboards, same ML. Just priced for tinkerers.

Community: Free forever · 5 nodes · non-commercial
Homelab: $90/yr · unlimited nodes · fair usage
> Start monitoring your lab—free
$1,000 Per Referral. Unlimited Referrals.

Your colleagues get 10% off. You get 10% commission. Everyone wins.

10% of subscriptions, up to $1,000 each
Track earnings inside Netdata Cloud
PayPal/Venmo payouts in 3-4 weeks
No caps, no complexity
> Get your referral link
Cost Proof
40% Budget Optimization

"Netdata's significant positive impact" — LANCOM Systems

Calculate Your Savings

Compare vs Datadog, Grafana, Dynatrace

Savings Proof
46% Cost Reduction

"Cut costs by 46%, staff by 67%" — Codyas

30% Cloud Bill Savings

"Reduced cloud bill by 30%" — Falkland Islands Gov

Enterprise Proof
"Better Than Combined Alternatives"

"Better observability with Netdata than combining other tools." — TMB Barcelona

Real Engineers, <24h Response

DPA, SLAs, on-prem, volume pricing

Why Partners Win
Demo Live Infrastructure

One command, 30 seconds, real data—no sandbox needed

Zero Tickets, High Margins

Auto-config + per-node pricing = predictable profit

Homelab Ready
"Absolutely Incredible"

"We tested every monitoring system under the sun." — Benjamin Gabler, CEO Rocket.Net

76k+ GitHub Stars

3rd most starred monitoring project

Worth Recommending
Product That Delivers

Customers report 40-67% cost cuts, 99% downtime reduction

Zero Risk to Your Rep

Free tier lets them try before they buy

Never Fight Fires Alone

Docs, community, and expert help—pick your path to resolution.

Learn.netdata.cloud docs
Discord, Forums, GitHub
Premium support available
> Get answers now
60 Seconds to First Dashboard

One command to install. Zero config. 850+ integrations documented.

Linux, Windows, K8s, Docker
Auto-discovers your stack
> Read our documentation
See Netdata in Action

Watch real-time monitoring in action—demos, tutorials, and engineering deep dives.

Product demos and walkthroughs
Real infrastructure, not staged
> Start with the 3-minute tour
Level Up Your Monitoring
Real problems. Real solutions. 112+ guides from basic monitoring to AI observability.
76,000+ Engineers Strong
615+ contributors. 1.5M daily downloads. One mission: simplify observability.
Per-Second. 90% Cheaper. Data Stays Home.
Side-by-side comparisons: costs, real-time granularity, and data sovereignty for every major tool.

See why teams switch from Datadog, Prometheus, Grafana, and more.

> Browse all comparisons
Edge-Native Observability, Born Open Source
Per-second visibility, ML on every metric, and data that never leaves your infrastructure.
Founded in 2016
615+ contributors worldwide
Remote-first, engineering-driven
Open source first
> Read our story
Promises We Publish—and Prove
12 principles backed by open code, independent validation, and measurable outcomes.
Open source, peer-reviewed
Zero config, instant value
Data sovereignty by design
Aligned pricing, no surprises
> See all 12 principles
Edge-Native, AI-Ready, 100% Open
76k+ stars. Full ML, AI, and automation—GPLv3+, not premium add-ons.
76,000+ GitHub stars
GPLv3+ licensed forever
ML on every metric, included
Zero vendor lock-in
> Explore our open source
Build Real-Time Observability for the World
Remote-first team shipping per-second monitoring with ML on every metric.
Remote-first, fully distributed
Open source (76k+ stars)
Challenging technical problems
Your code on millions of systems
> See open roles
Talk to a Netdata Human in <24 Hours
Sales, partnerships, press, or professional services—real engineers, fast answers.
Discuss your observability needs
Pricing and volume discounts
Partnership opportunities
Media and press inquiries
> Book a conversation
Your Data. Your Rules.
On-prem data, cloud control plane, transparent terms.
Trust & Scale
76,000+ GitHub Stars

One of the most popular open-source monitoring projects

SOC 2 Type 2 Certified

Enterprise-grade security and compliance

Data Sovereignty

Your metrics stay on your infrastructure

Validated
University of Amsterdam

"Most energy-efficient monitoring solution" — ICSOC 2023, peer-reviewed

ADASTEC (Autonomous Driving)

"Doesn't miss alerts—mission-critical trust for safety software"

Community Stats
615+ Contributors

Global community improving monitoring for everyone

1.5M+ Downloads/Day

Trusted by teams worldwide

GPLv3+ Licensed

Free forever, fully open source agent

Why Join?
Remote-First

Work from anywhere, async-friendly culture

Impact at Scale

Your work helps millions of systems

Compliance
SOC 2 Type 2

Audited security controls

GDPR Ready

Data stays on your infrastructure

Netdata vs Checkmk

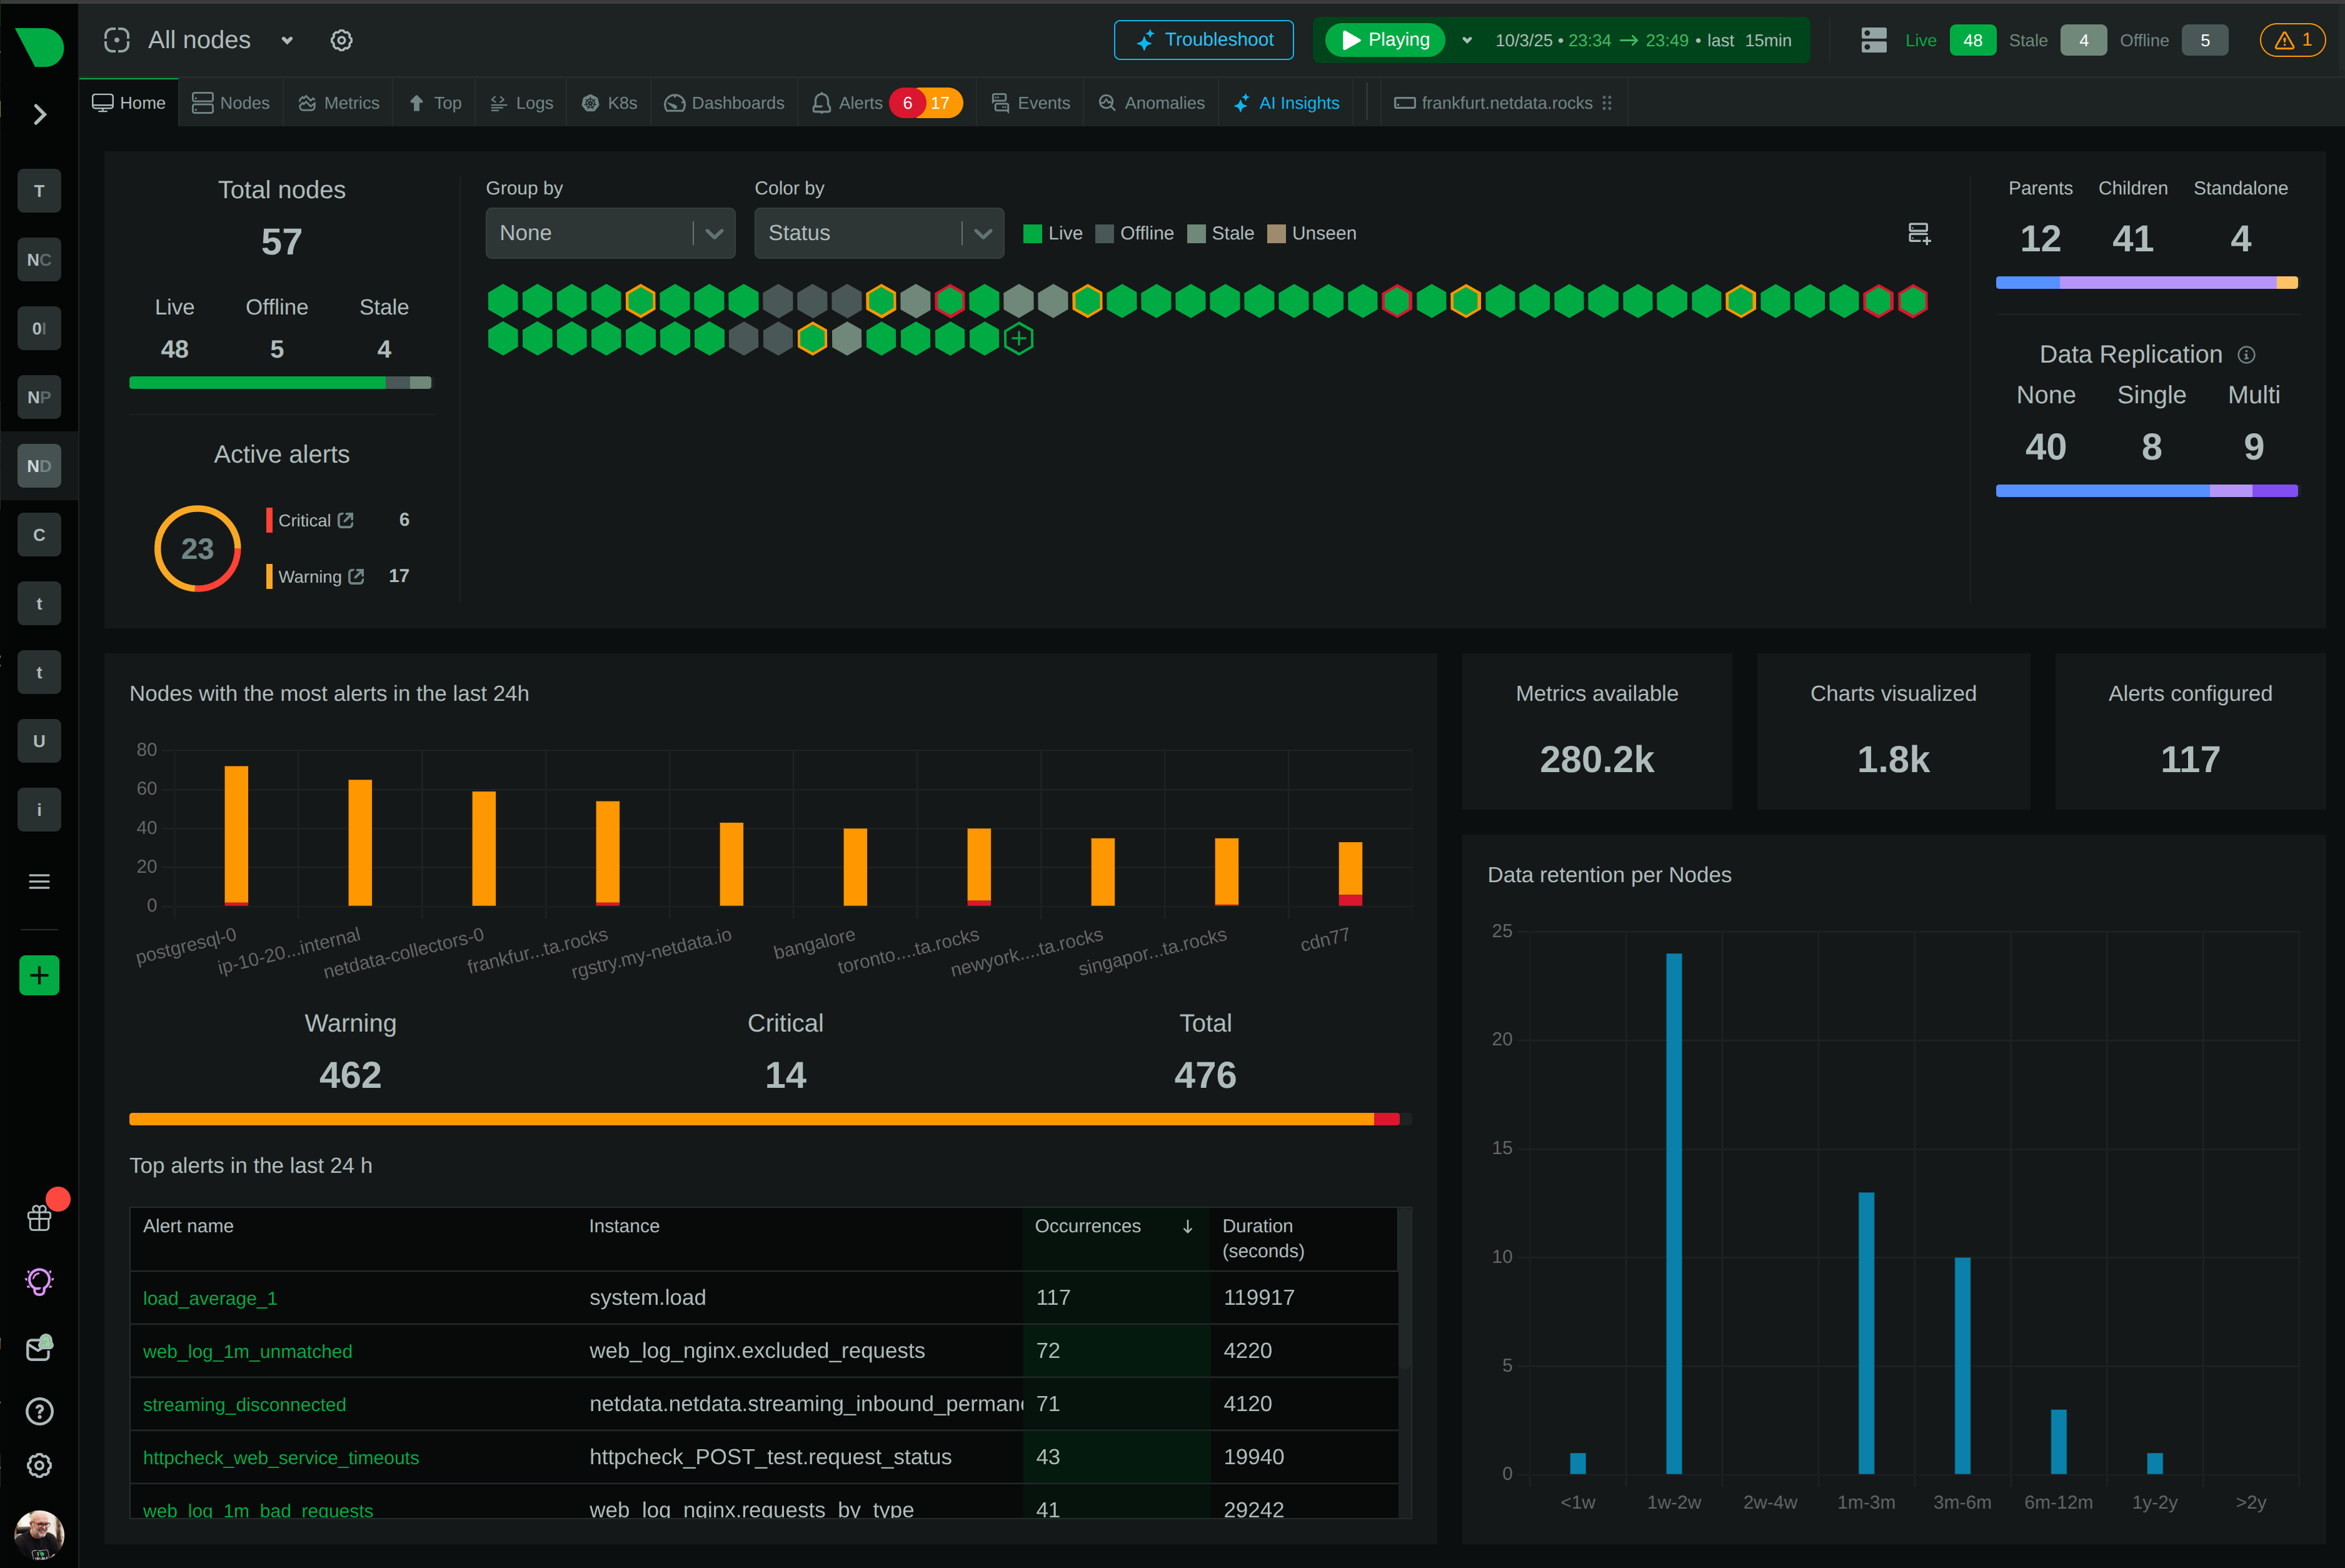
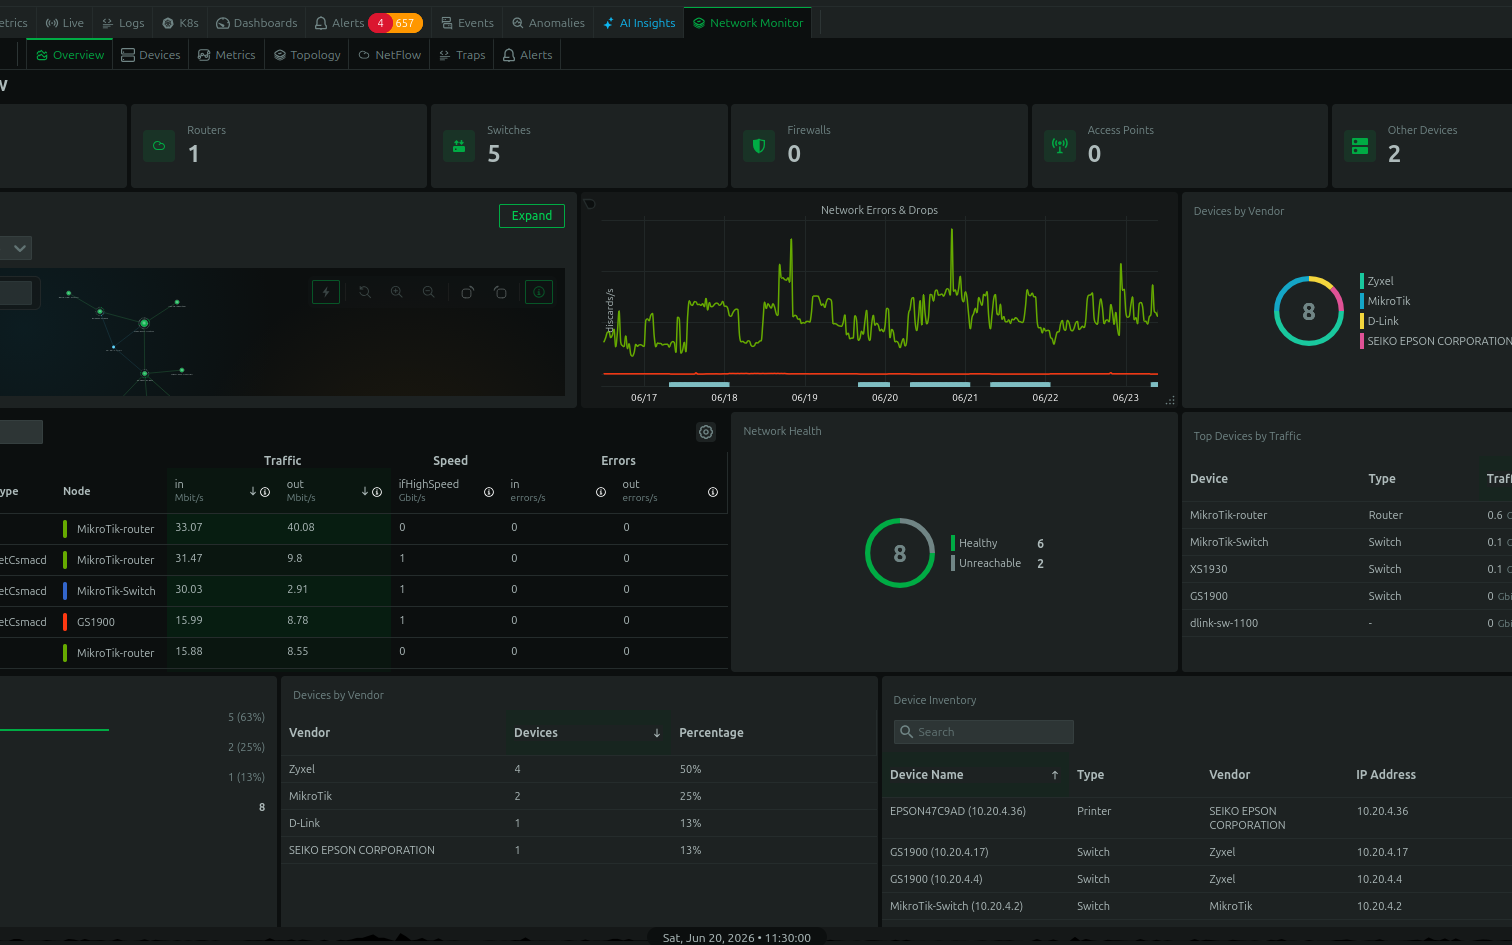
See Every Second That Matters

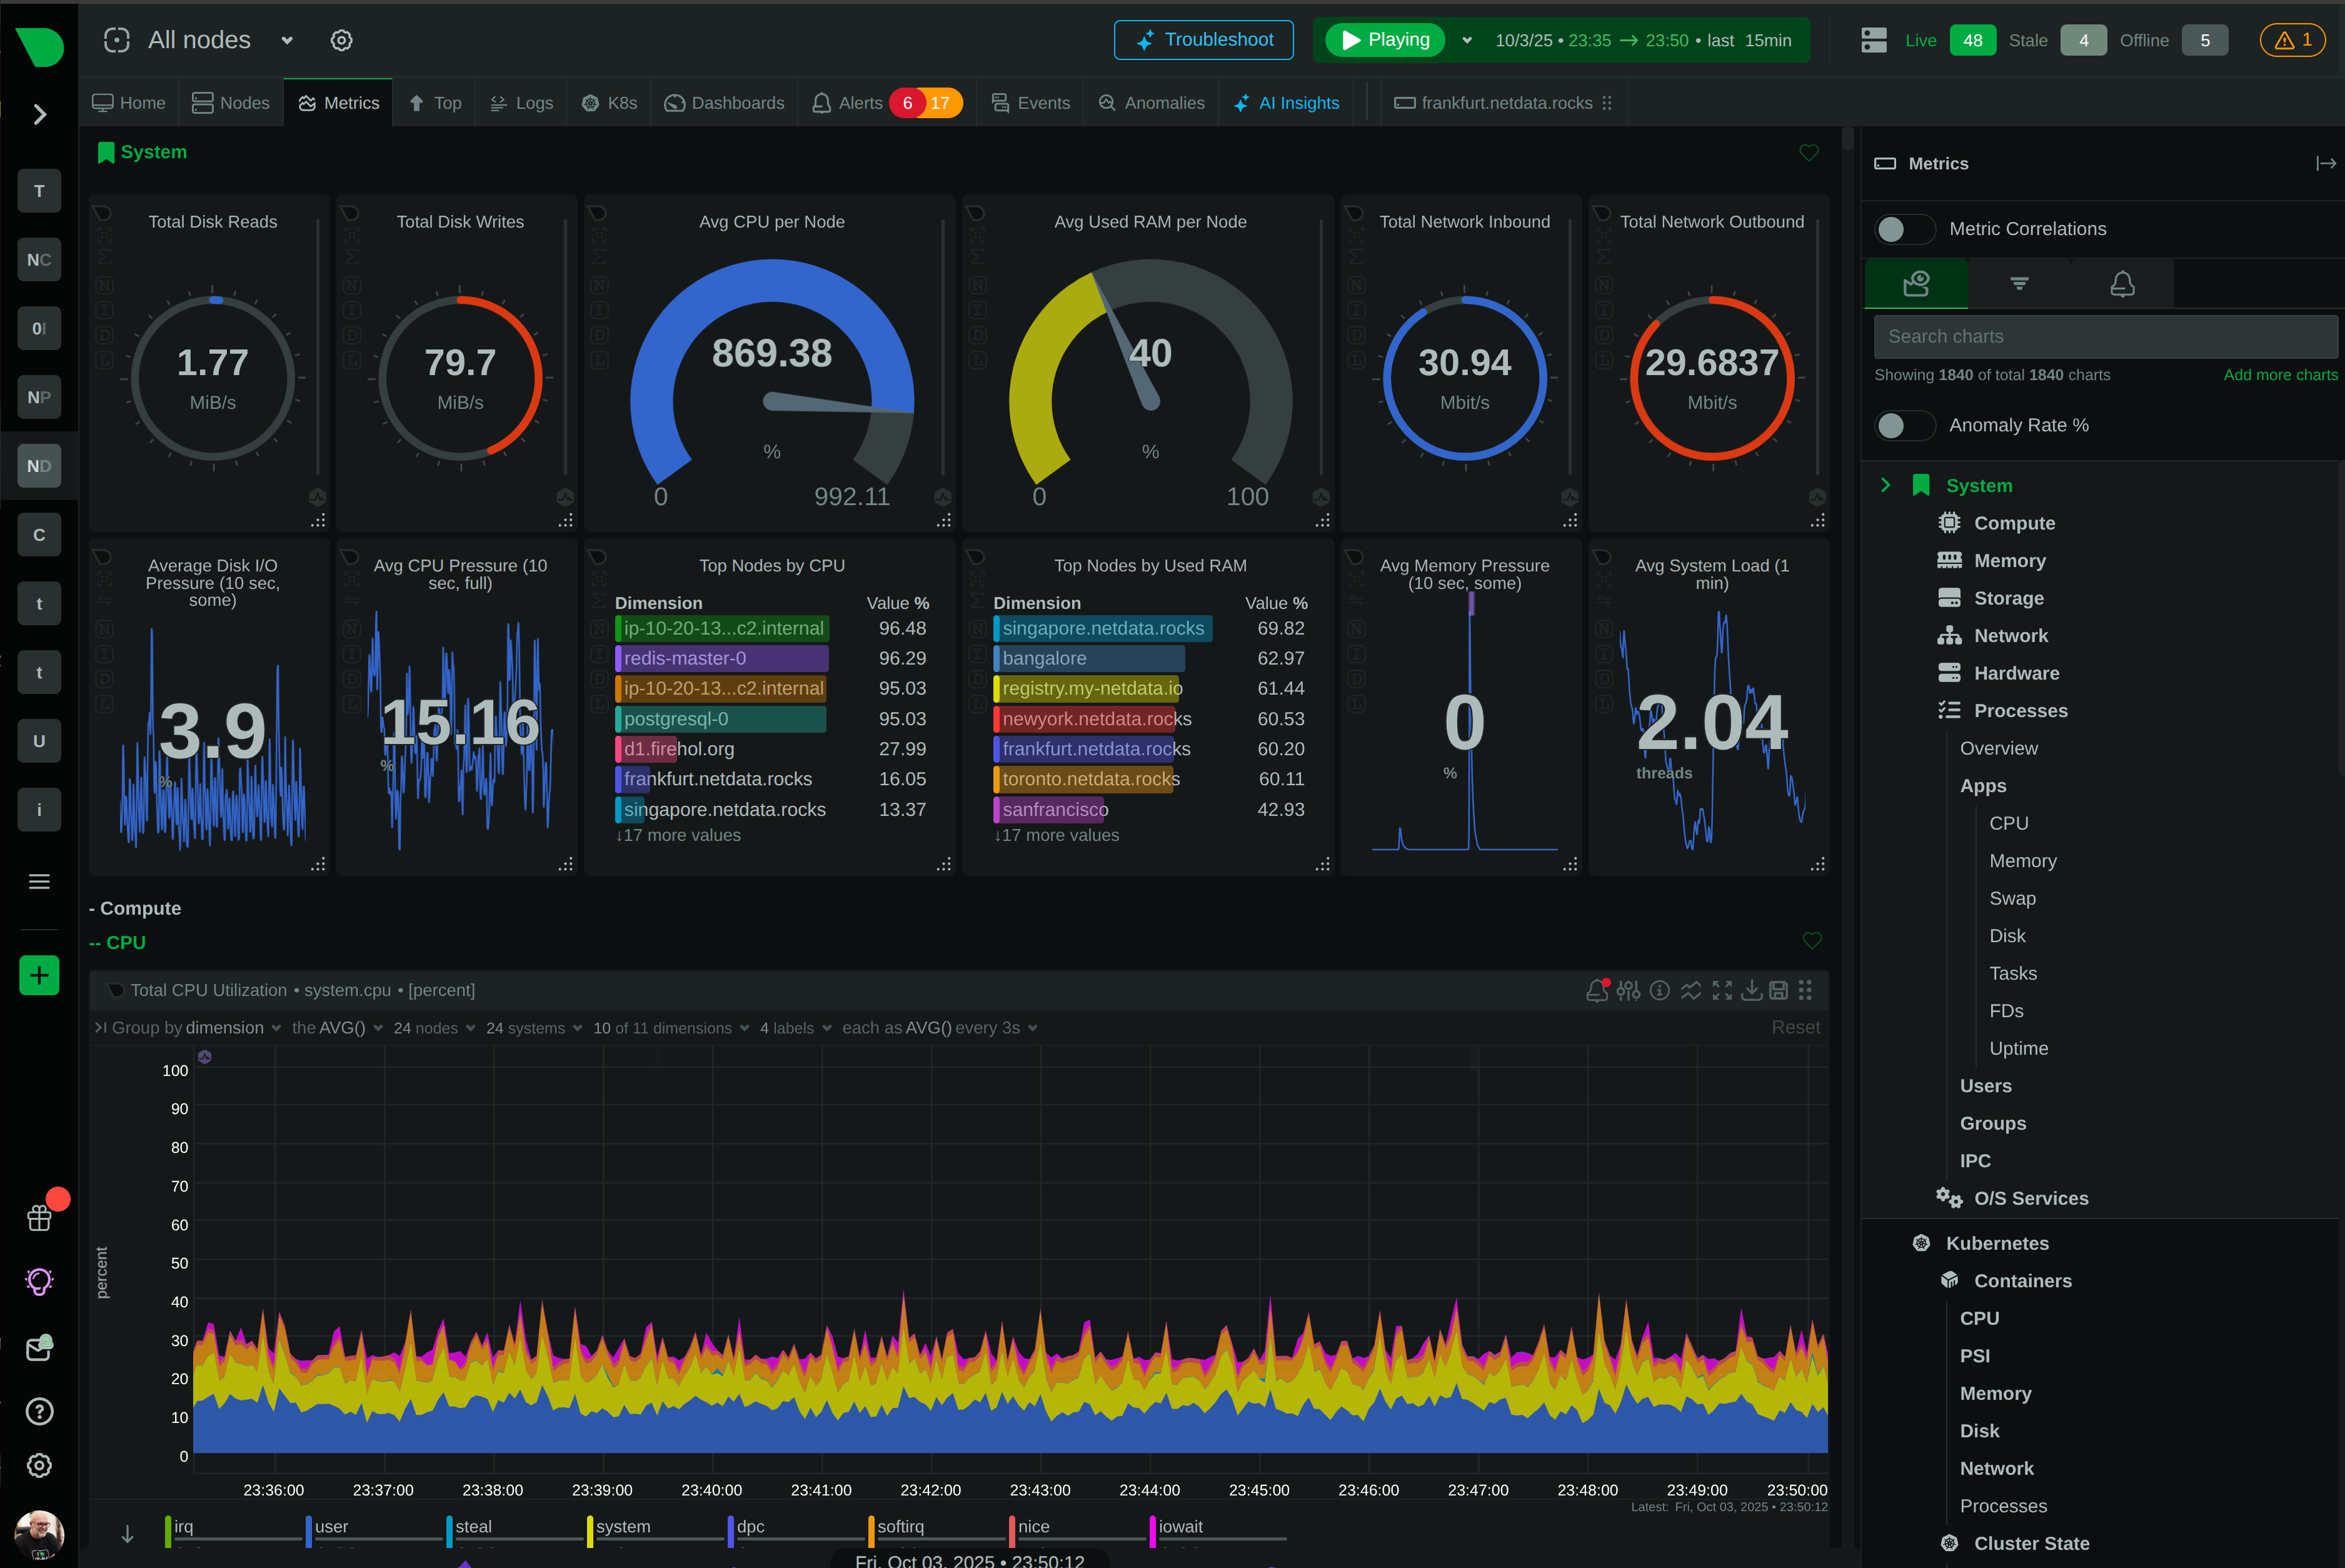
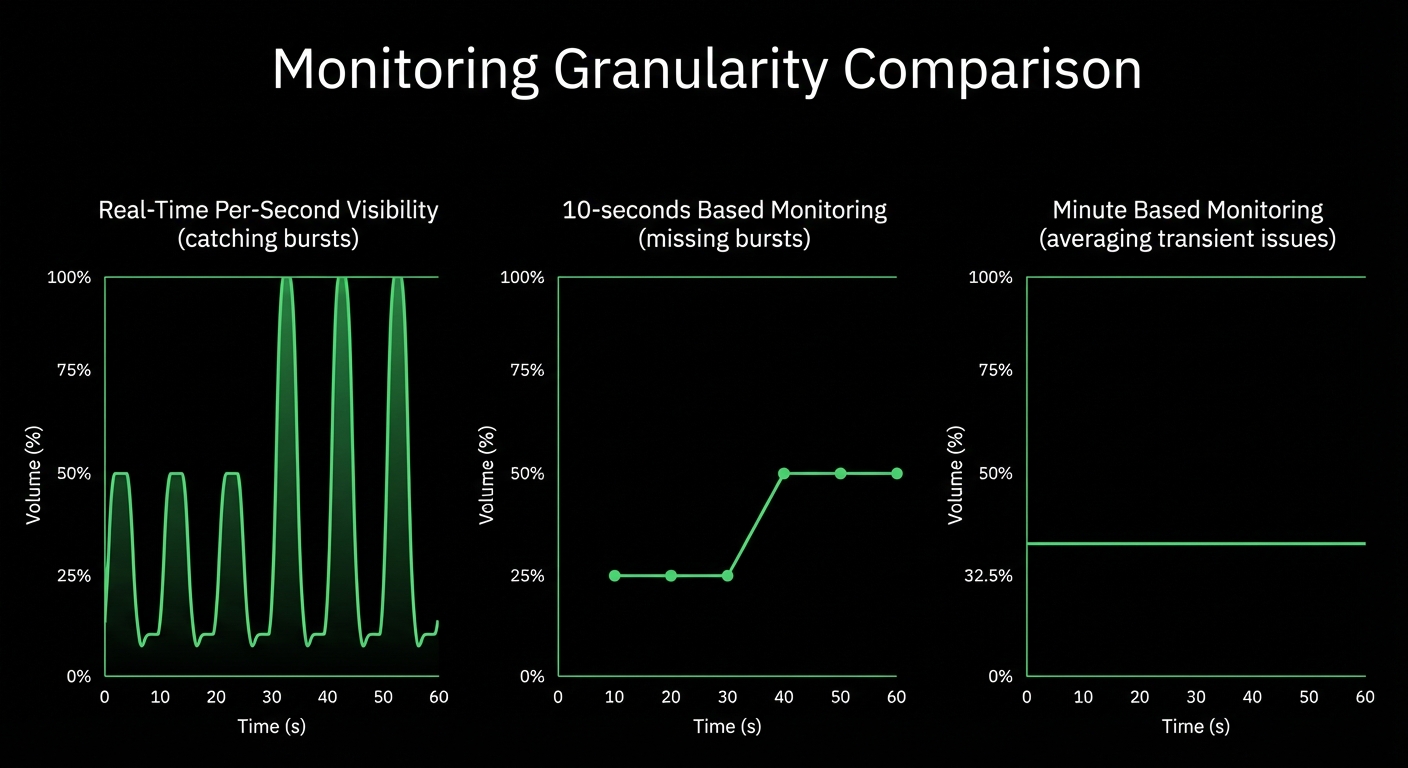
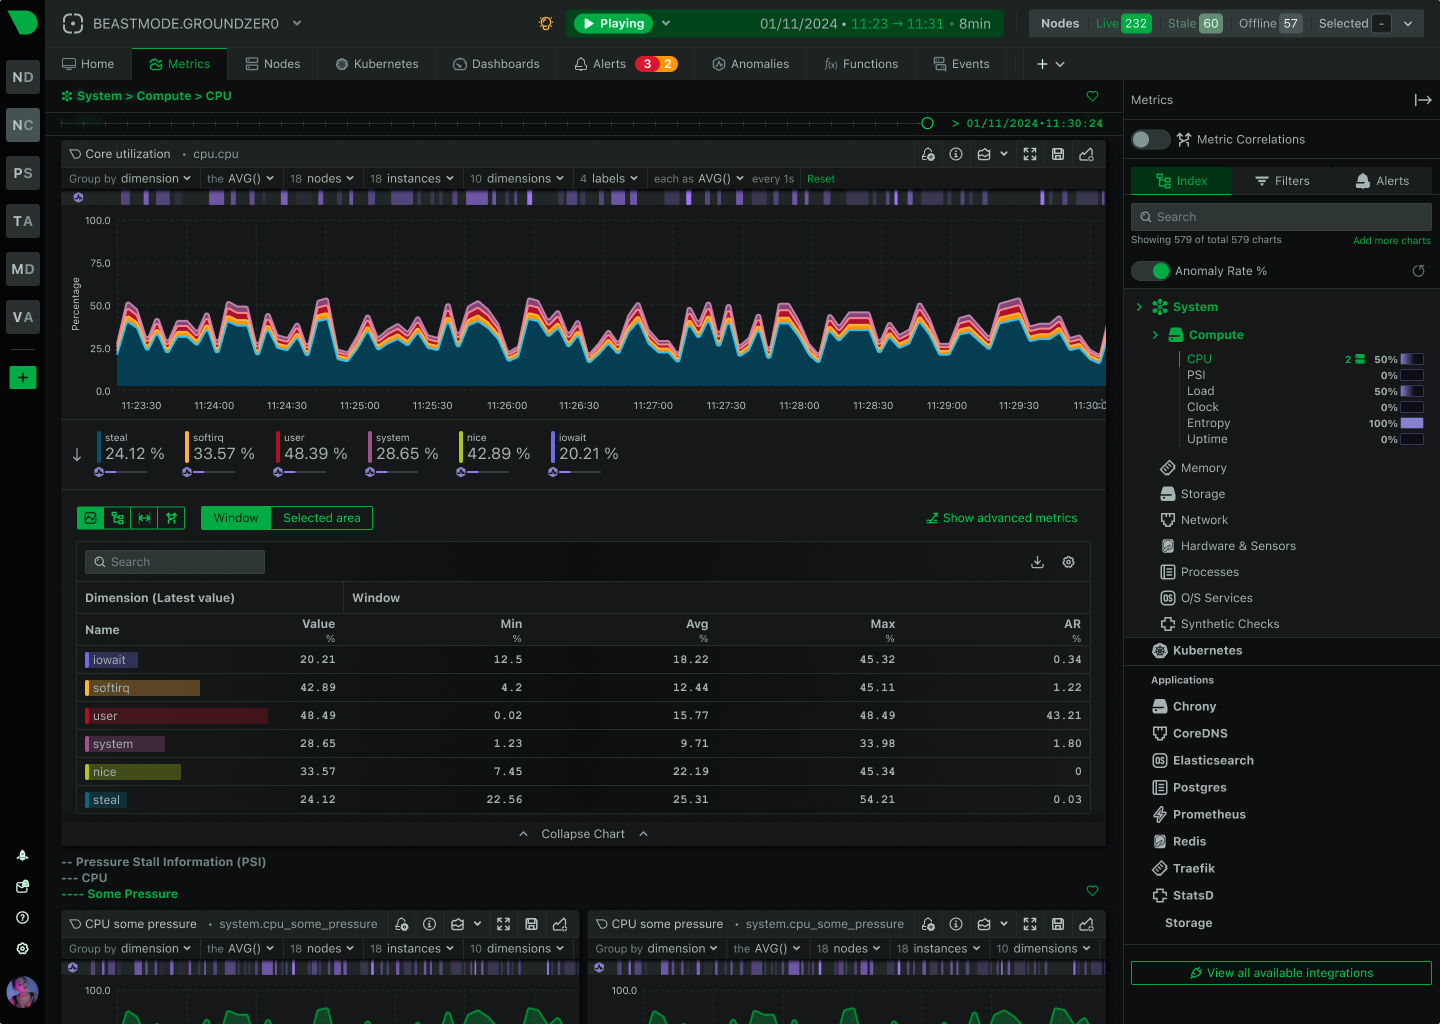
While Checkmk averages away your problems with 60-second intervals, Netdata reveals infrastructure reality at per-second precision. Experience monitoring that moves at the speed of your operations - not a minute behind them.

Background Hero

Why Teams Choose Netdata Over Checkmk

Transform operations from complexity management to instant productivity

True Real-Time Visibility

Per-second monitoring reveals transient issues invisible to Checkmk’s 60-second intervals. See microbursts, container lifecycles, and cascading failures as they happen.

AI-Powered Troubleshooting

Unsupervised ML trains 18 models per metric automatically. AI Co-Engineer explains root causes in plain English. Anomaly detection significantly reduces false positives.

Zero Configuration Required

From installation to first dashboard in 60 seconds. No 700+ rule sets to master. No query languages to learn. Automatic discovery, algorithmic dashboards, instant productivity.

Predictable Cost Savings

Transparent per-node pricing eliminates billing surprises. 90% cost reduction typical vs per-service models. Unlimited metrics, logs, and users included.

Linear Scalability

Distributed edge architecture scales from 1 to 100,000 nodes without architectural changes. 36% less CPU, 88% less RAM at scale. No central bottlenecks.

Operational Simplicity

Self-maintaining platform requires zero ongoing tuning. Junior engineers get senior-level visibility automatically. No training courses, no expertise barriers.

Trusted by DevOps teams worldwide

Platform Comparison

Netdata vs Checkmk

How the platforms differ in approach, architecture, and operational philosophy

Netdata

Checkmk

Data Granularity

✅ 1-second
True real-time monitoring

⚠️ 60-second default
Near real-time with averaging

Visualization Latency

✅ 1-second
Sub-2-second event-to-insight

⚠️ Delayed
Minutes from collection to dashboard

Configuration Required

✅ Zero
Automatic discovery and setup

❌ Extensive
700+ rule sets to master

Learning Curve

✅ Instant productivity
No training required

❌ Steep
4-day training courses mandatory

Machine Learning

✅ Unsupervised ML
18 models per metric, automatic

⚠️ Statistical only
Basic predictive monitoring

AI Capabilities

✅ AI Co-Engineer
Natural language troubleshooting

❌ Not available
No AI integration

Architecture

✅ Distributed edge
Intelligence at the source

⚠️ Centralized
Traditional hub-and-spoke

Scalability

✅ Linear
1 to 100K nodes, same design

⚠️ Bottlenecks
Performance degrades at scale

Pricing Model

✅ Per-node
Transparent and predictable

❌ Per-service
Unpredictable with containers

Data Sovereignty

✅ Complete
All data stays local

⚠️ Centralized storage
Local but aggregated

Maintenance

✅ Self-maintaining
Zero ongoing tuning

❌ Continuous tuning
Rules, thresholds, dashboards

Focus

✅ Operations-first
Troubleshooting and resolution

⚠️ Enterprise IT
Traditional infrastructure

Experience the Netdata Advantage

Catch Problems Before They Cascade

Per-second monitoring reveals the micro-world where your infrastructure actually operates. See CPU spikes lasting 3 seconds, network microbursts, container lifecycles, and cascading failures invisible to 60-second averages. University of Amsterdam research confirms Netdata as the most energy-efficient monitoring solution - even while collecting every second.

10-60× faster visibility

See Real-Time Monitoring

Catch Problems Before They Cascade

Eliminate Configuration Complexity

While Checkmk forces you to master 700+ rule sets and folder hierarchies, Netdata just works. Install in 60 seconds. Dashboards generate algorithmically. ML trains automatically. Alerts work immediately. No query languages, no manual dashboard building, no threshold tuning. Your team solves problems instead of managing monitoring.

60 seconds to first dashboard

Experience Zero Configuration

Eliminate Configuration Complexity

Let AI Handle the Heavy Lifting

Netdata trains 18 unsupervised ML models per metric - billions across your infrastructure - achieving 99% false positive reduction in anomaly detection through consensus-based detection. The AI Co-Engineer explains root causes in plain English. Anomaly Advisor surfaces the 30-50 metrics that matter during incidents. Component-level alerts with intelligent thresholds help teams focus on actionable issues.

99% false positive reduction

Explore AI Features

Let AI Handle the Heavy Lifting

Scale Without Architectural Changes

Netdata’s distributed edge architecture scales linearly from 1 to 100,000 nodes. Each agent is a complete observability engine - collection, storage, ML, alerting, visualization. Adding nodes doesn’t affect existing ones. No central bottlenecks. At 4.6M metrics/second, Netdata uses 36% less CPU, 88% less RAM, and 97% less disk I/O than traditional solutions while providing 16× faster queries.

36% less CPU at scale

Understand the Architecture

Scale Without Architectural Changes

Feature Comparison

Monitoring Features Side by Side

Comprehensive capability comparison across observability dimensions

Netdata

Checkmk

Infrastructure Monitoring

✅ Comprehensive
CPU, memory, storage, network

✅ Comprehensive
Full system coverage

Container Monitoring

✅ Native Kubernetes
Per-second pod/container metrics

⚠️ Supported
Basic container support

Cloud Monitoring

✅ AWS, Azure, GCP
Native cloud integrations

✅ Special agents
Cloud platform support

Process Monitoring

✅ Real-time
Per-second process metrics

✅ Comprehensive
Process tracking

Network Monitoring

✅ Per-connection
Real-time bandwidth tracking

✅ SNMP extensive
2000+ device plugins

Database Monitoring

✅ Auto-discovery
MySQL, PostgreSQL, MongoDB, etc

✅ Comprehensive
Database coverage

Logs Management

✅ Zero pipeline
Direct journal access, 90% cost reduction

⚠️ Event Console
Syslog to event processing

Distributed Tracing

⚠️ Q2 2026
OpenTelemetry traces planned

⚠️ Beta
Jaeger OTLP experimental

Synthetic Monitoring

⚠️ Basic
HTTP checks, custom scripts

✅ Advanced
Robotmk integration

Custom Metrics

✅ Unlimited
StatsD, OpenMetrics, no pricing penalty

✅ Extensive
Custom checks, MKP plugins

Hardware Monitoring

✅ Comprehensive
IPMI, sensors, GPUs, EDAC ECC

✅ Comprehensive
Enterprise hardware support

Windows Monitoring

✅ Native
Event Logs, ETW, performance counters

✅ Native
Windows agent support

View All Integrations

Key Capabilities That Set Netdata Apart

See Infrastructure Reality

Per-second monitoring reveals the micro-world where problems actually happen. Catch transient issues, microbursts, and cascading failures invisible to minute-averaged data.

10-60× faster than traditional monitoring

Learn About Real-Time
Real-Time Dashboard

Use Case Comparison

Netdata vs Checkmk Use Cases

How each platform addresses common monitoring scenarios

Netdata

Checkmk

Real-Time Operations

✅ Ideal
Per-second visibility, instant feedback

⚠️ Limited
60-second intervals miss transients

Live Troubleshooting

✅ Console replacement
Browser-based debugging with history

⚠️ Basic
Traditional monitoring approach

Kubernetes Monitoring

✅ Cloud-native
Per-second pod/container tracking

⚠️ Supported
Basic container support

Capacity Planning

✅ AI-powered
Automated insights and forecasting

✅ BI module
Dedicated reporting capabilities

Alert Configuration

✅ Pre-configured
400+ component-level alerts included

⚠️ Manual tuning
Requires threshold configuration

Root Cause Analysis

✅ AI-powered
Anomaly Advisor, blast radius detection

⚠️ Manual
Dependency mapping requires config

Cloud Migration

✅ Cloud-native
Built for modern infrastructure

⚠️ Traditional
Legacy IT focus

Multi-Cloud

✅ Unified
AWS, Azure, GCP in one platform

✅ Supported
Special agents for clouds

DevOps Workflows

✅ Zero friction
Instant setup, no maintenance

❌ High friction
700+ rules, continuous tuning

Team Onboarding

✅ Instant
No training required

❌ Slow
4-day courses, 2-6 months proficiency

SNMP Devices

✅ Comprehensive
Full network device support

✅ Extensive
2000+ device plugins

Synthetic Testing

⚠️ Basic
HTTP checks, custom scripts

✅ Advanced
Dedicated Robotmk integration

Frequently Asked Questions