Samba Monitoring
What Is Samba?
Samba is an open-source software suite that provides seamless file and print services to SMB/CIFS clients. It facilitates interoperability between Linux/Unix servers and Windows-based clients, allowing for file sharing and printer services. For detailed information, visit the Samba official website.
Monitoring Samba With Netdata
Netdata offers a comprehensive solution for monitoring Samba by utilizing its advanced collector: the go.d.plugin for Samba. This powerful $name monitoring tool provides real-time insights into Samba operations without the need for cumbersome configurations or extensive permissions, ensuring that you can monitor Samba instances effortlessly.
Explore our Samba collector documentation to get started with this $name monitoring tool.
Why Is Samba Monitoring Important?
Monitoring Samba is crucial for maintaining the efficiency and performance of your network file sharing architecture. By tracking critical metrics, you can ensure smooth operations, detect potential bottlenecks, and prevent service downtimes. Effective Samba monitoring enhances data security, optimizes performance, and enhances user satisfaction.
What Are The Benefits Of Using Samba Monitoring Tools?
Utilizing tools for monitoring Samba, like Netdata, brings numerous advantages:
- Real-Time Monitoring: Obtain live data feeds to immediately spot irregularities.
- Detailed Insights: Gain a thorough understanding of system calls and SMB2 operations.
- Proactive Alerting: Set up alerts based on real-time metrics to stay ahead of potential issues.
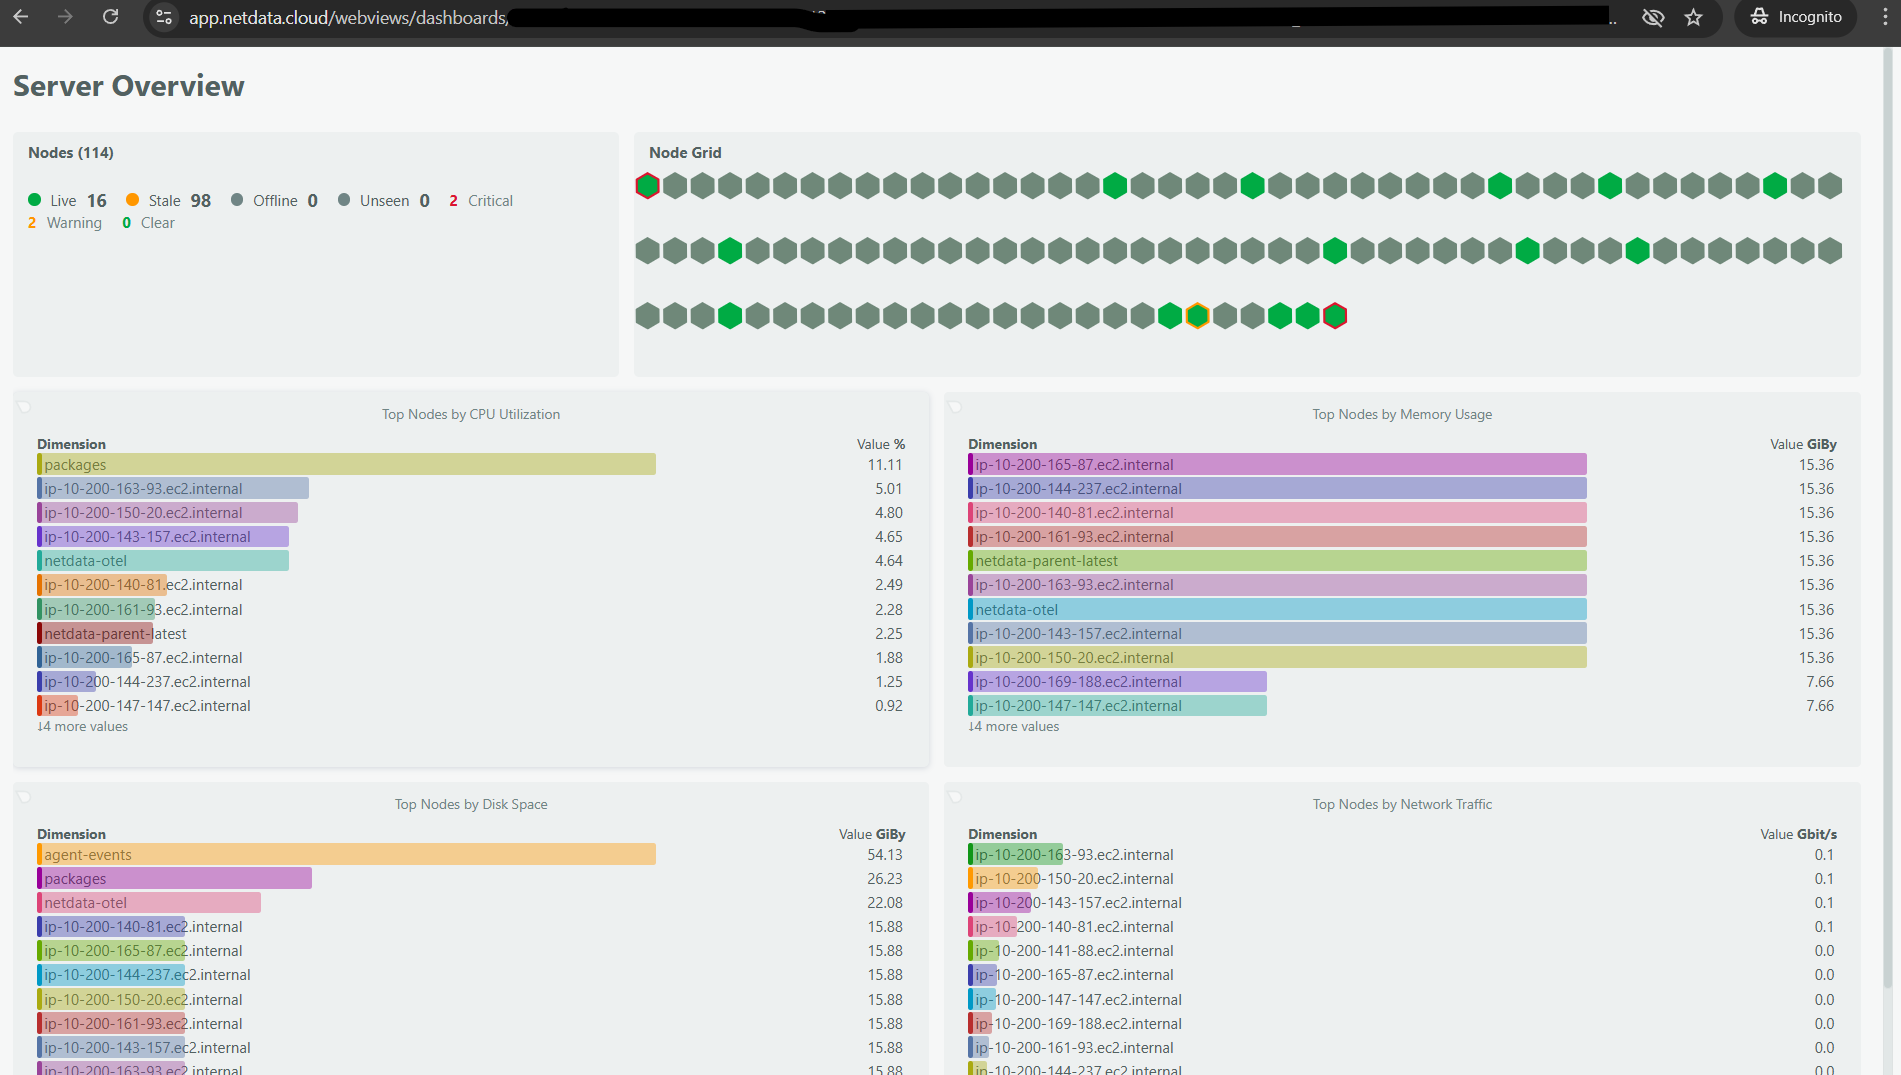
- Comprehensive Dashboard: Utilize visual dashboards to effectively analyze data and trends.
Understanding Samba Performance Metrics
Understanding the key performance metrics is essential for effective $name monitoring.
Syscall Metrics
- Syscalls Count: Tracks the number of syscalls executed per second.
- Syscalls Transferred Data: Monitors the data transferred via syscalls in bytes per second.
SMB2 Call Metrics
- SMB2 Calls Count: Represents the number of SMB2 calls executed per second.
- SMB2 Call Transferred Data: Measures the incoming and outgoing data via SMB2 calls in bytes per second.
These Samba performance metrics provide insightful information essential for monitoring your network’s file-sharing capabilities.
| Metric Name | Description |
|---|---|
| samba.syscall_calls | Syscalls Count, measured in calls per second. |
| samba.syscall_transferred_data | Data transferred via syscalls in bytes/s. |
| samba.smb2_call_calls | SMB2 Calls Count, measured in calls per second. |
| samba.smb2_call_transferred_data | SMB2 Call Transferred Data in bytes/s. |
Advanced Samba Performance Monitoring Techniques
For advanced $name monitoring, consider enabling profiling for detailed performance analysis. Follow the instructions in our Samba collector documentation to verify and enable profiling.
Diagnose Root Causes Or Performance Issues Using Key Samba Statistics & Metrics
Monitoring key Samba statistics and metrics diligently helps in diagnosing root causes and performance issues. Utilizing Netdata’s real-time monitoring, set up custom alerts and dive deep into performance trends to proactively address issues as they arise.
For a holistic view of Samba performance, consider exploring our Live Demo to see Netdata in action, or sign up for a free trial today.
FAQs
What Is Samba Monitoring?
Samba monitoring involves tracking the performance metrics related to the Samba server to ensure efficient file-sharing operations and to troubleshoot potential issues.
Why Is Samba Monitoring Important?
Monitoring Samba is essential to maintain file-sharing efficiency, optimize performance, enhance security measures, and prevent service downtime.
What Does A Samba Monitor Do?
A Samba monitor tracks the real-time performance of Samba servers, analyzing syscalls and SMB2 operations to provide actionable insights.
How Can I Monitor Samba In Real Time?
Netdata offers real-time monitoring of Samba through the go.d.plugin. By collecting and analyzing performance metrics, Netdata provides immediate insights and trend analysis to support effective monitoring of Samba infrastructure.


