Squid Monitoring
What Is Squid?
Squid is a caching and forwarding web proxy that optimizes web delivery and reduces bandwidth. By storing copies of frequently requested web content, Squid enhances response times and reduces server loads. With a rich feature set supporting HTTP, HTTPS, FTP, and more, Squid plays a crucial role in optimizing web proxies.
Monitoring Squid With Netdata
To effectively monitor Squid log files, Netdata offers an insightful solution through its go.d.plugin. The Squid monitoring tool from Netdata focuses on parsing access log files to give you real-time visibility into your Squid server operations. This ensures that you can track server responses, bandwidth usage, and client interaction in real-time.
Why Is Squid Monitoring Important?
Monitoring Squid is paramount in maintaining the health and efficiency of proxy services. Traffic analysis, cache hit ratios, and client trends ensure optimal configuration and resource allocation. Identifying issues before they escalate minimizes downtime and enhances user satisfaction and resource utilization.
What Are The Benefits Of Using Squid Monitoring Tools?
Using tools for monitoring Squid, like Netdata, provides comprehensive insights into your proxy’s operations. Benefits include:
- Real-time metrics and alerts to preemptively tackle performance issues.
- Detailed traffic analysis supporting optimal resource management.
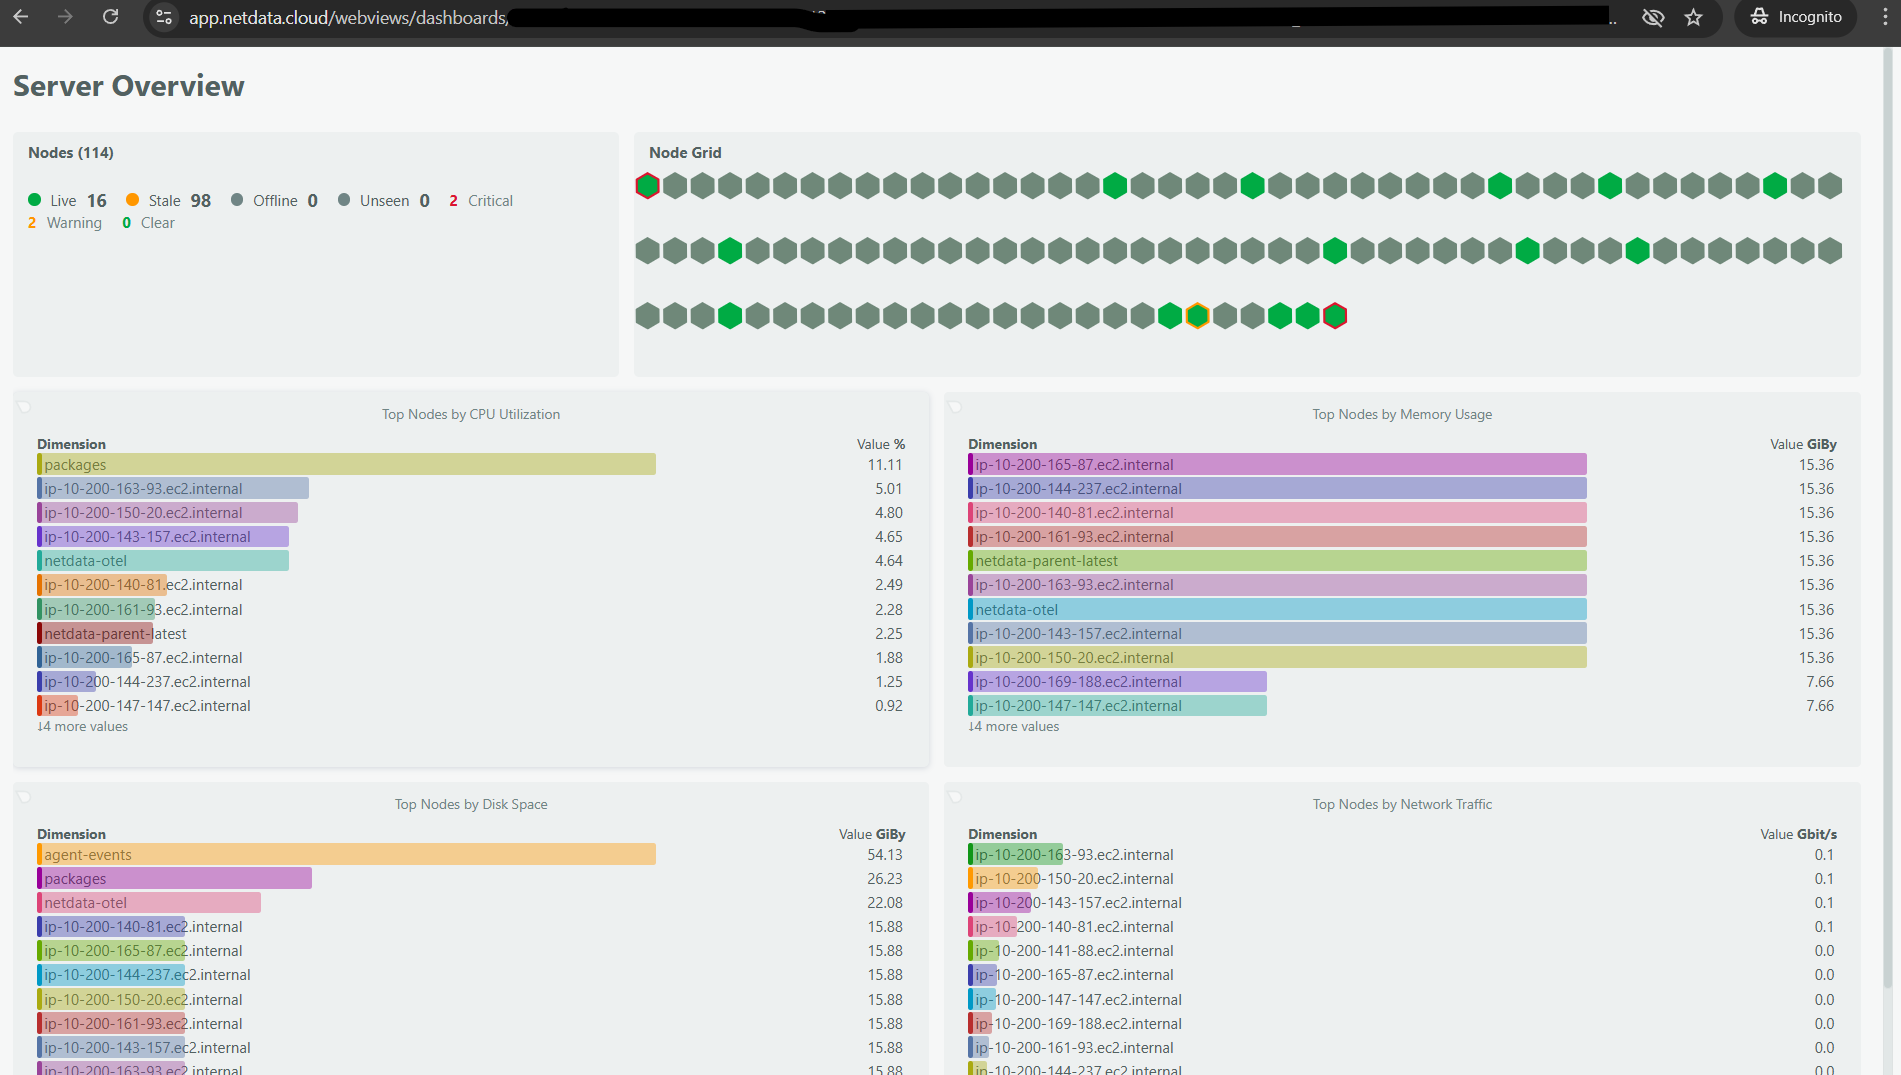
- Visualizations that help in understanding client behaviors and network load.
Understanding Squid Performance Metrics
Here are some key metrics that Netdata monitors for Squid:
Total Requests
Tracks the total number of requests handled by the Squid server. Indicator of server load and usage.
Response Time
Reports the minimum, maximum, and average response times in milliseconds for requests handled.
Bandwidth
Monitors the amount of data, in kilobits per second, sent over the network through Squid.
Requests By HTTP Method
Provides insight into the types of requests (GET, POST, etc.) processed and their frequency.
Requests By HTTP Status Code
Displays the distribution of different HTTP response codes, indicating the success rate of handled requests.
Unique Clients
Number of distinct clients interacting with the proxy, reflecting user engagement.
| Metric Name | Description |
|---|---|
| squidlog.requests | Total number of requests handled per second. |
| squidlog.response_time | Log of response times from the server in ms. |
| squidlog.bandwidth | Amount of data transmitted in kilobits per second |
| squidlog.uniq_clients | Counts unique client connections to Squid. |
| squidlog.http_method_requests | Breakdown by HTTP methods like GET, POST, etc. |
| squidlog.http_status_code_responses | Summary of responses by HTTP status codes. |
Advanced Squid Performance Monitoring Techniques
Advanced monitoring includes setting up custom alerts for specific metrics, tracking specific traffic patterns, and implementing performance improvements based on detailed insights. Detailed collector documentation further enhances your monitoring setup.
Diagnose Root Causes Or Performance Issues Using Key Squid Statistics & Metrics
Diagnosing Squid performance issues involves close scrutiny of real-time metrics. By leveraging Netdata’s real-time data visualization and alerting, you can quickly identify bottlenecks, inefficient caching strategies, or unusual spikes in traffic.
With these insights, you can make data-driven decisions to optimize your Squid proxy environment. View Netdata Live or Sign Up for Free Trial to start monitoring Squid now.
FAQs
What Is Squid Monitoring?
Squid monitoring involves tracking and analyzing the operations and performance of Squid servers to ensure they are functioning optimally.
Why Is Squid Monitoring Important?
It provides visibility into server functions, helps prevent downtime, and ensures efficient resource management.
What Does A Squid Monitor Do?
A Squid monitor collects and visualizes data regarding response times, request types, and client interactions, providing actionable insights.
How Can I Monitor Squid In Real Time?
Using Netdata’s Squid monitoring tool allows you to monitor Squid in real-time, continuously collecting detailed metrics from Squid’s log files.


